How To Forecast Diversity With Predictive Data Analytics
How can you make predictions about the future diversity of your organization, with a model grounded in real data? In this tutorial we will explain how diversity projections work in Pirical On Demand (POD).
Pirical On Demand is a library of over 1,000 tried-and-tested analyses, kept up to date with your firm’s data. HR professionals use POD to benchmark statistics against competitors, to analyze bias in recruitment and work allocation systems, and for real-time or predictive capabilities like highlighting which employees may need extra support. POD addresses all core diversity traits: Gender, Ethnicity, Social Mobility, Sexual Orientation, Disability, Age, and Religion.
Pirical has been supporting law firms to forecast diversity representation since 2018
Our latest model is now available to customers today through POD, a self-service analytics platform.
Diversity projections are an essential tool for:
- Unifying stakeholders around the state of diversity today
- Identifying the most effective levers for change
- Setting and evaluating progress against diversity targets
- Defining the boundaries of healthy progress: avoiding underperformance (discrimination risk) and overperformance (affirmative action risk)
The model is designed on the principle that what has happened in the last 5 years is a good baseline for what might happen in the next 5 to 10 years.
Projections in POD are available for all roles, both timekeepers/fee earners and staff/business professionals.
Projections can be generated for any diversity trait, practice group, business function or office.
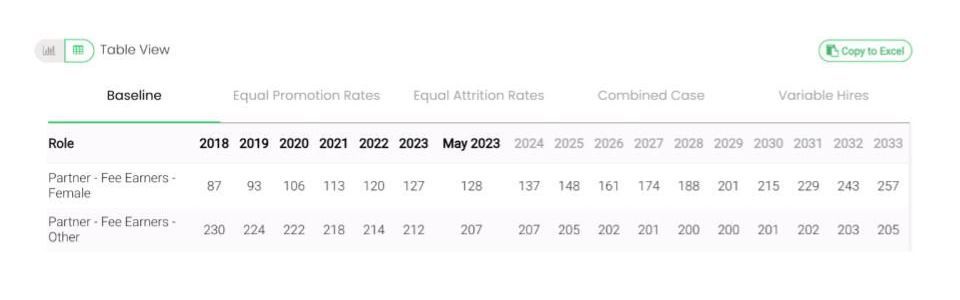
Users with the right privileges can also access the underlying headcounts generated by the model.
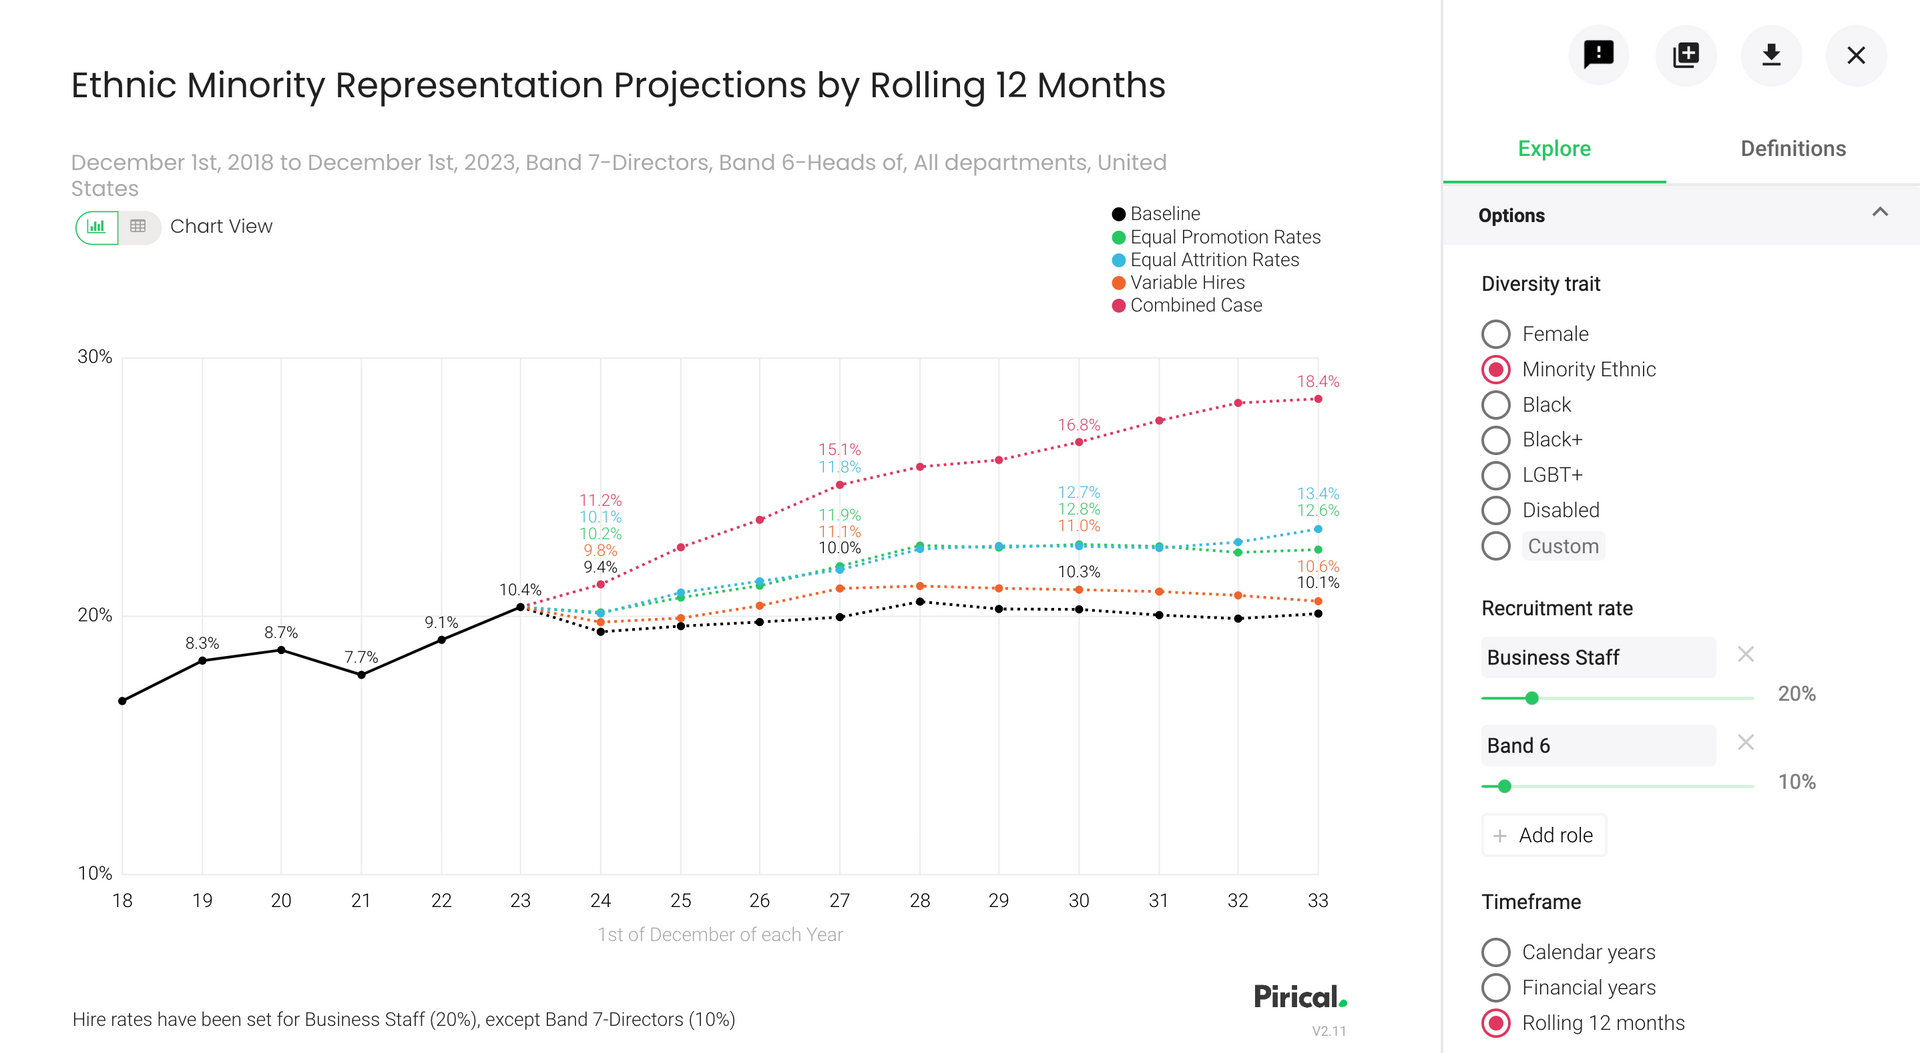
POD generates three scenarios to illustrate their relative impacts on the rate of diversification:
- Equal promotion rates (for example, the number of women promoted is proportional to the population of women)
- Equal attrition rates (for example, the number of women leaving is proportional to the population of women)
- Custom diversity of new hires - set your own parameters for roles and employee categories
As well as the combined scenario: what is possible if multiple scenarios are achieved.
The model uses recent historical trends to project the future
The algorithm takes, for every role in a law firm over the last 5 years:
- Recruitment rates and diversity of new hires
- Attrition rates and diversity of leavers
- Promotion rates and diversity of promotions
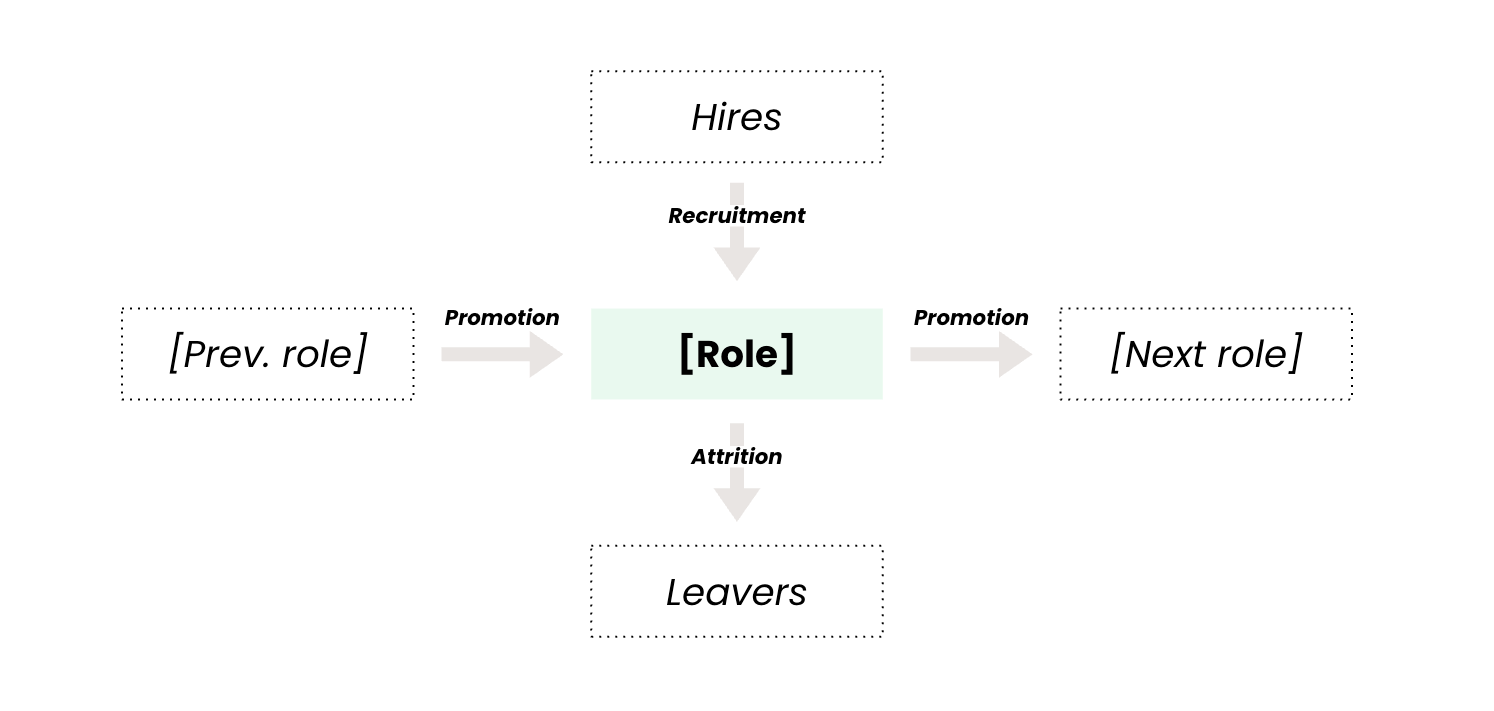
Then steps forward with these numbers each year to see how representation is expected to evolve, if the firm keeps going as it has.
Headcounts are rounded to the nearest whole individual.
No artificial growth rates are imposed at any level. Instead roles will have their 'natural growth rate'. For example, if the 5-year rate of recruitment for a role has been higher than the 5-year rate of attrition, then the role might increase headcount over time.
Career ladders are not linear
An important aspect of the model is that it takes into account the whole network of roles in your firm, including moves that deviate or flow against the traditional pathways. For example, the model might take into account individuals' different pathways to partnership:
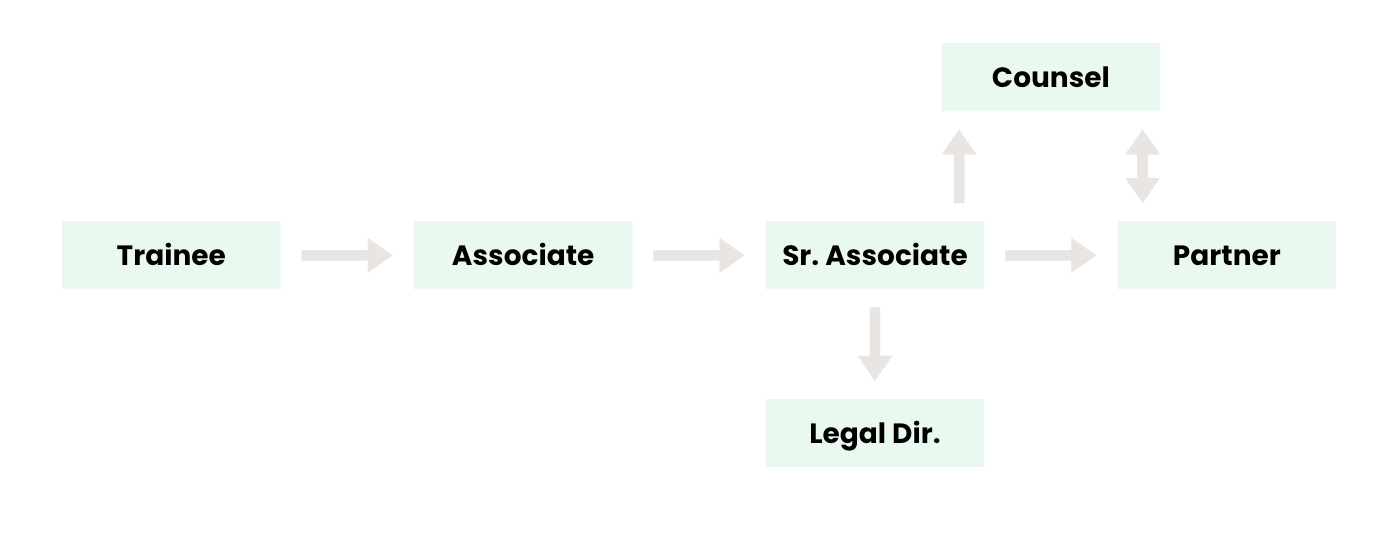
This will look different for each firm, as roles and movements will vary.
The Pirical team can help you get the most from projections
Pirical analysts are available to support customers with training and advice, or on a project basis to manage complex projects involving projections. Contact us today for a quote.
Not yet a Pirical On Demand customer?
Explore the demo today to see the power of On Demand.
Contact Us
Stay up-to-date with the latest market insights and law firm rankings
Subscribe to email updates
Subscribe to content


