
Secrets of Associate Productivity 1: Is There A ‘High Productivity’ Leverage Model?
Productivity is a hot topic for law firms. Uncovering what the most productive firms are doing differently promises to help firms maximize their revenues, without needing to hire more people or increase prices for clients.
Pirical has been working with customers to diagnose their current state of productivity and to test ideas about what really drives productivity across the market.
Case study: Firm X is a Mid-Market National Firm in the UK
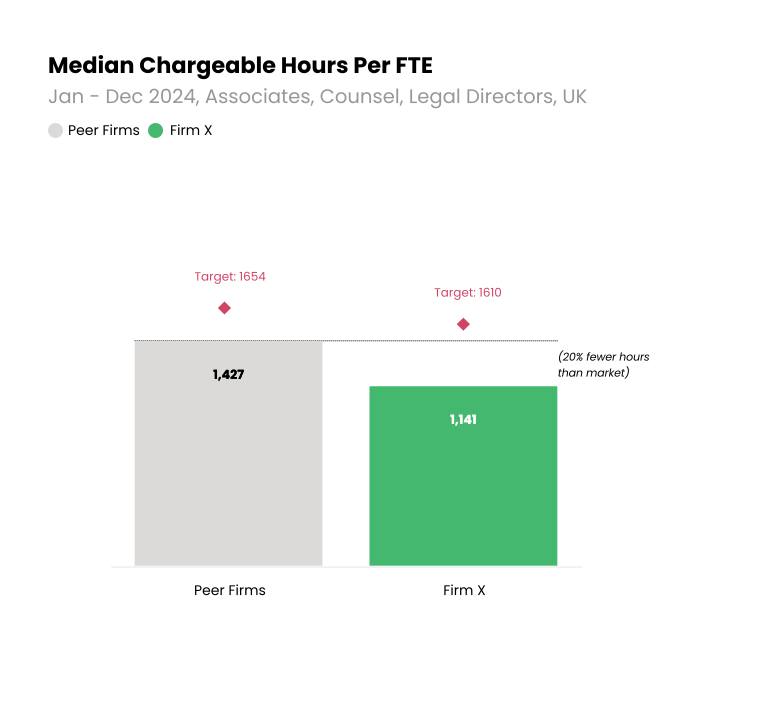
Firm X’s Associates Are 20% Or £10m Per Year Less Productive Than Peer Firms’, Despite Having Similar Chargeable Hours Targets.
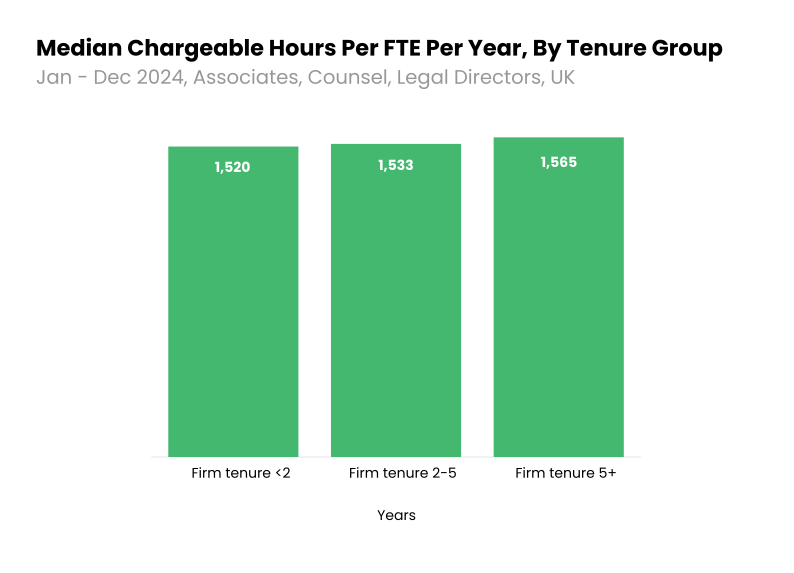
Across the Market, We Know that New Starters Are Up to 3% Less Productive Than Long-Tenured Associates. Could Low Attrition Rates Be One of the Things Peer Firms Are Doing Differently?
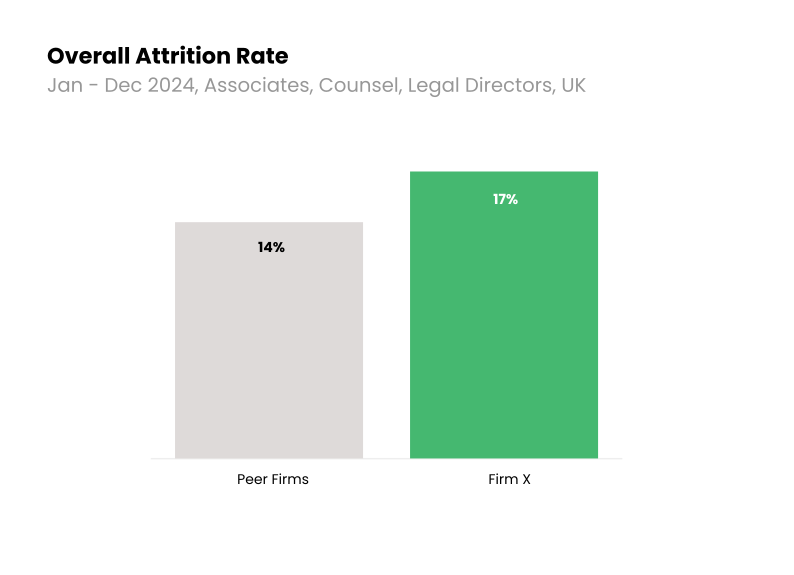
💭 Does Firm X Have Particularly High Attrition?
Peer firms do have lower attrition than Firm X.
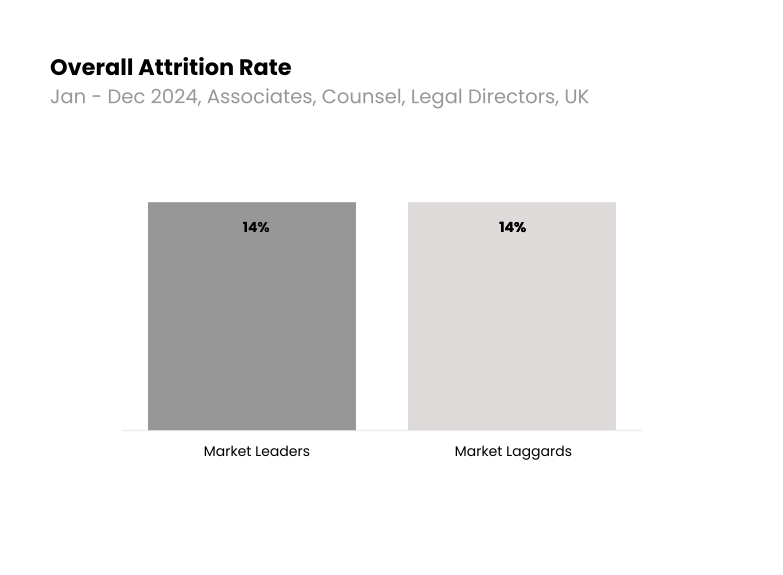
💭 Would We Expect High Attrition to Drive Low Productivity?
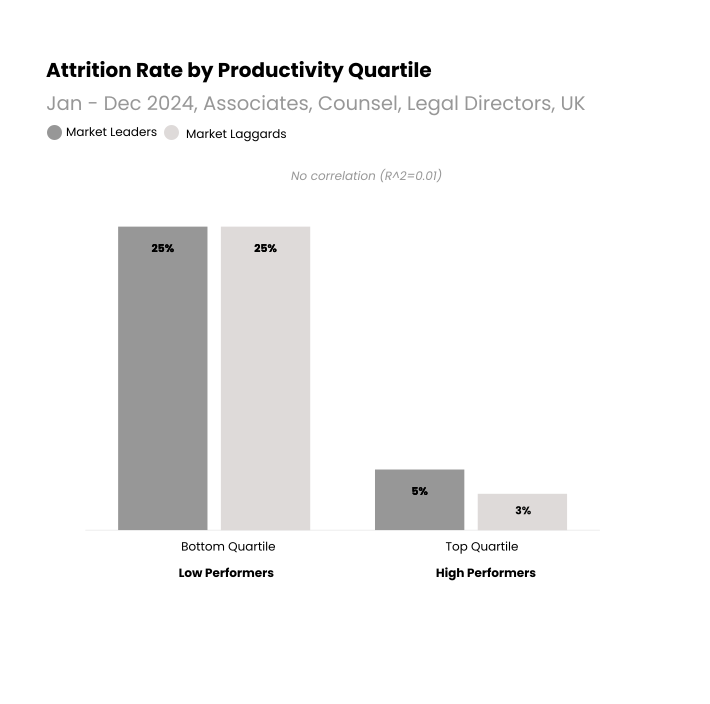
In general, we wouldn’t expect associate attrition to drive productivity. If we look at the most productive firms in the market (the leaders) attrition is similar to the least productive firms (the laggards).
💭 Are the Most Productive Firms Better At Exiting Low-Productivity Lawyers (‘Low Performers’) and Retaining High-Productivity Lawyers (‘High Performers’)?
When we segmented attrition by productivity quartile, we found that the most productive firms and the least productive firms are exiting low performers, and retaining high performers, at similar rates.
💭 What About Firm X?
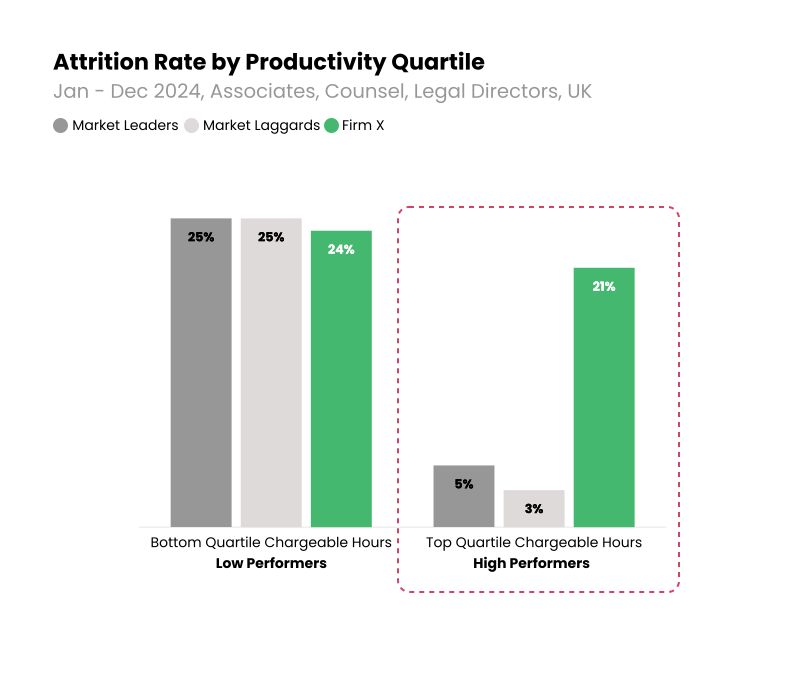
Firm X is losing significantly more high performers than low performers.
When it comes to attrition, while Firm X is out of step with peers, we wouldn’t these issues to be a primary driver of their low productivity.
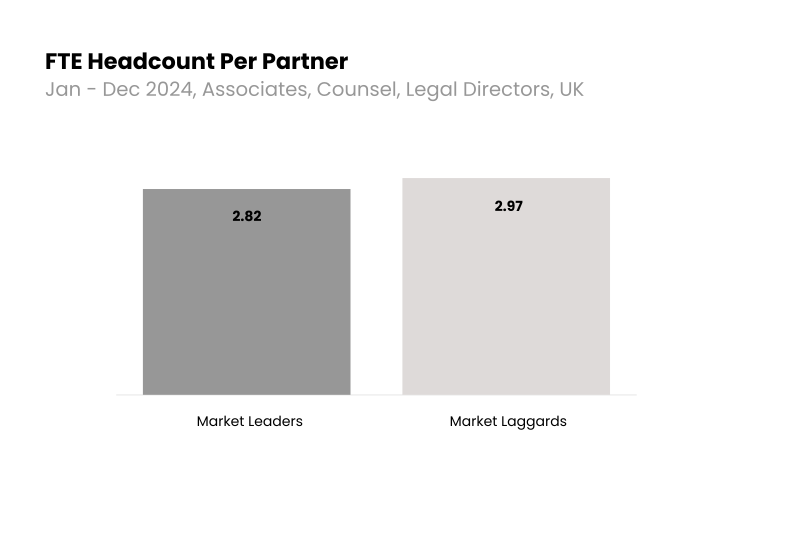
One Hypothesis is That Peer Firms Might be Structured in a Particularly High-Productivity Way, Perhaps with Fewer Associates Per Partner (So There’s More Work to Go Around).
While very important to partner profitability, it turns out that overall associate:partner leverage ratios do not differentiate the most productive firms from the least productive firms.
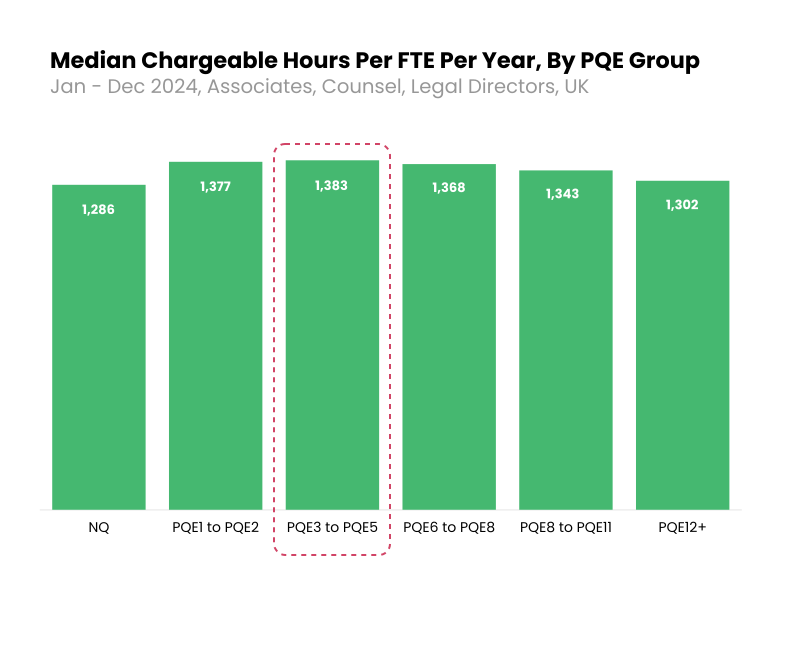
We can see, however, that associate productivity does vary by seniority with a peak around 3-5 years of experience.
Firm X does actually have higher overall leverage than the market.
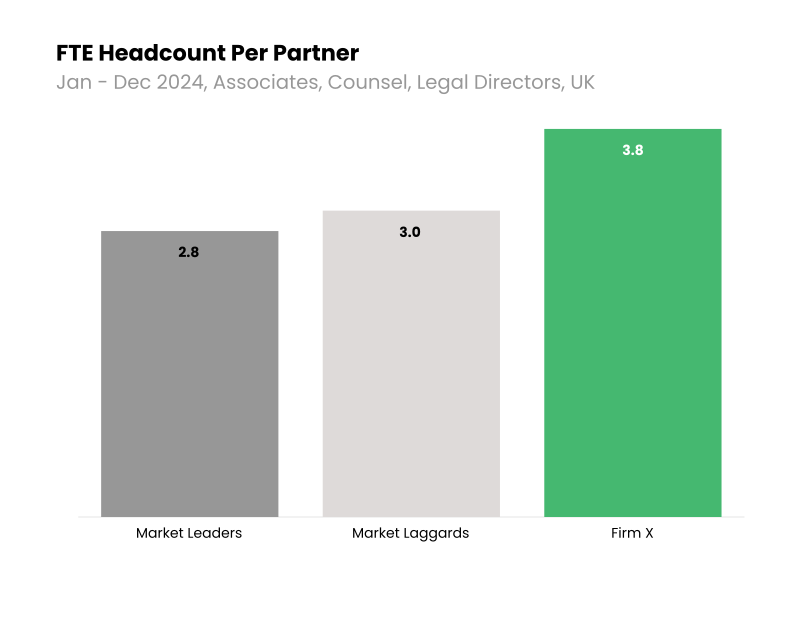
💡 But That Leverage at Firm X is Concentrated in a Generally Low-Productivity Seniority Group (Associates With 12+ Years of Experience).
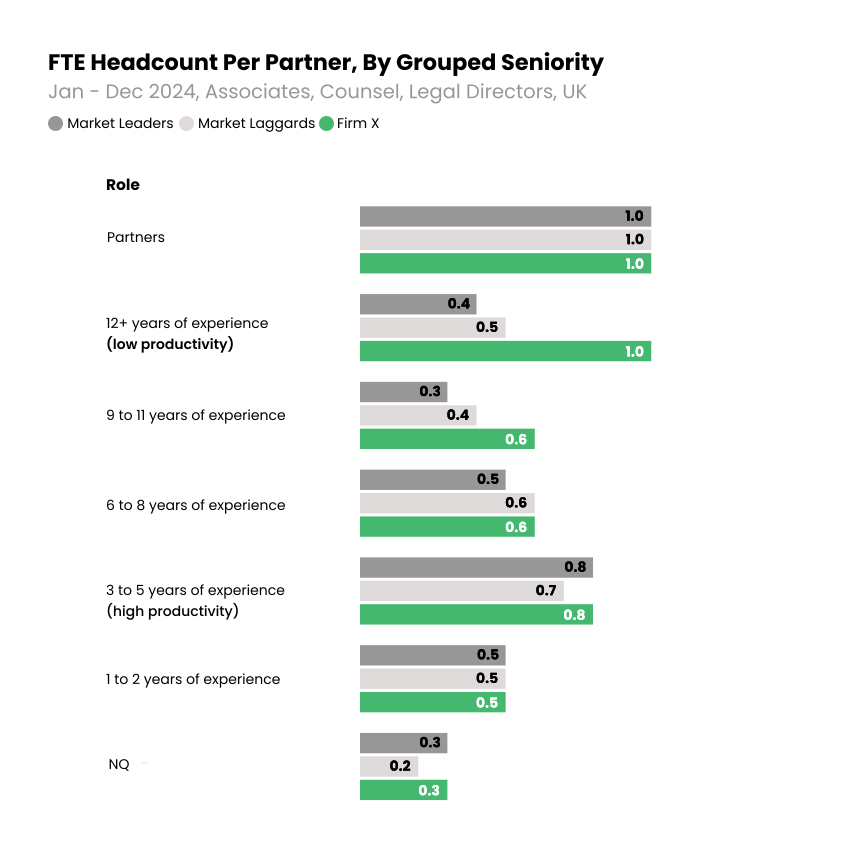
These two actionable opportunities are examples of many identified by Pirical for Firm X. Together they will help close the £10m revenue gap between peers and better compete in today’s legal market.
Analysis powered by Pirical on Demand (POD)
Pirical's award-winning technology unifies legal data to power the business of law
See this analysis with your firm's data and much more with a
Pirical On Demand subscription.
Receive exclusive tailored insights into critical challenges facing law firms. Learn what the top firms are doing that others can learn from.
Stay up-to-date with the latest market insights and law firm rankings
Subscribe to email updates
Subscribe to content