
Which Metrics Really Matter: a Pirical Analysis
The next generation of law firm leaders face difficult decisions with no precedent to fall back on. Grow revenues when clients are pushing back on prices, and cut costs during an escalating salary war. In the meantime, AI continues to change what clients think a lawyer's hour is worth. Reporting tells you how well you did, and benchmarking tells you where you stand. Neither tells you where your opportunities are.
Polaris is the solution that gives law firm leadership the knowledge of their firm's performance across each practice, and the modelled profit opportunity within each metric.
To illustrate what this might be worth, we have modelled data for ' Practice X ', a synthetic practice group of approximately 49 qualified lawyers, 13 equity partners, and £27m annual revenue. Using pooled data from law firms across a basket of key operational metrics, we've uncovered how the market varies and what a jump from the bottom quartile ('among the worst') to the top quartile ('among the best') of performance in each metric would actually be worth, in pounds, to Practice X. Practice X sucks: they are bottom quartile of the market for everything. The question is, what should they work on first?
Our analysis shows why picking your battles is wildly important.
The Metrics Wasting Your Time
The metrics below are worth under £5m a year to Practice X.
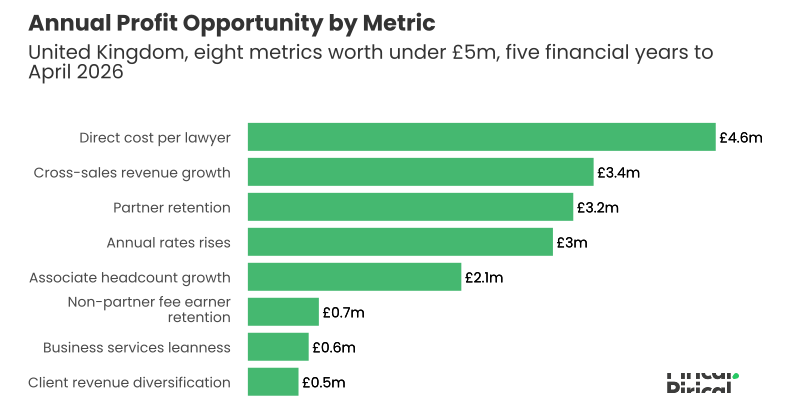
Below, we outline why these metrics might not be the battles most worth fighting for Practice X.
The Gaps Firms Can See are Often the Ones Worth Least
Some of our metrics have a very wide market spread, with comparatively little reward. This makes them easy distractions to the uncritical eye.
Firms are more spread out on associate headcount growth than on any other metric we measured, yet it presents one of our smallest profit opportunities. Cross-sales revenue growth (revenue growth from selling additional practices into existing clients) and annual rates rises (how fast the firm puts its rates up each year) are also very spread across the market, and both sit near the bottom for profit.
All three are visible in the market, which makes them straightforward to build a case around internally. A firm can look at a genuine gap between itself and its peers, fund the work to close it, but ultimately find a low return in the end. For Practice X , these are not the metrics that matter most.
Junior Retention, Back Office and Client Mix All Sit at the Bottom
Improving non-partner fee earner retention to top-of-market levels is worth just £0.7m to Practice X. Leaders championing investment in this area may find little bang-for-buck.
Business services leanness (the number of business services professionals compared to fee earners) is worth £0.6m and client revenue diversification (how concentrated revenue is in the largest clients) £0.5m. Neither the back office nor the shape of a firm's client base carries much profit opportunity either way to Practice X , and none of these three metrics are where a typical practice's time is best spent.
Cost Per Lawyer is in the Middle
The annual cost of employing each non-partner lawyer (including salaries and bonuses) medians at about £98,000. Around £31,000 per non-partner lawyer separates the bottom quartile from the top, and at £4.6m it sits just about in the middle for profit opportunity.
The Metrics That Really Matter
Leave us your email to know which metrics are actually worth investing in.
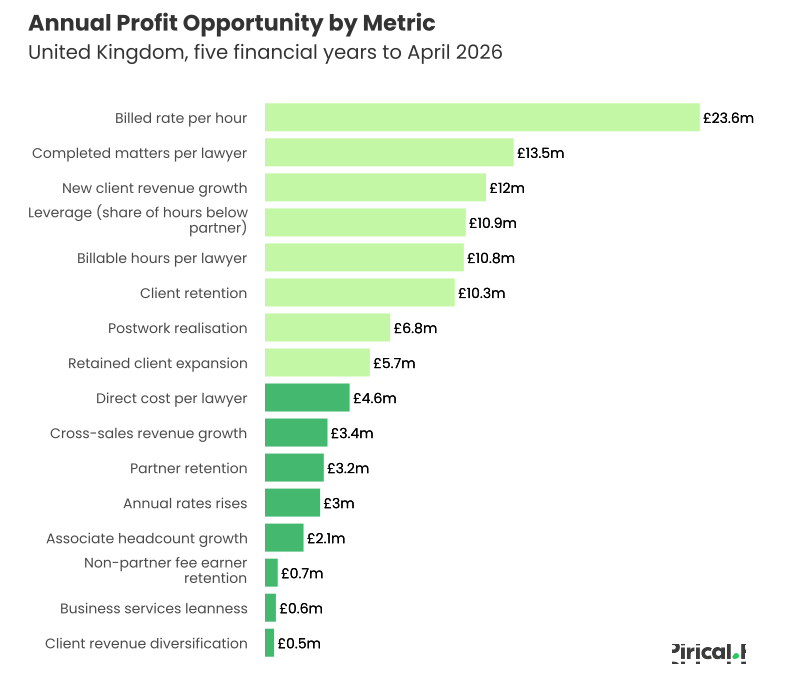
Where would your firm's biggest opportunity sit?
These figures describe the market. Which move any particular firm should make first depends on its own numbers, and on the peers it would genuinely compare itself against. Polaris models that, practice by practice.
Learn moreAn annual presentation for firm leadership, with the peer group chosen by the firm.
Which of these moves should your firm make first?
The figures above are market-wide. They do not tell you which move any particular firm should prioritise, because that depends on the firm's own numbers and on the peers it would genuinely compare itself against. That's what Polaris is built for.
Learn morePolaris uses benchmarking data across these metrics and more, with the peer group chosen by the firm.
Methodology
Timeframe: Five financial years, 1 May 2021 to 30 April 2026.
Scope: UK offices, measured at practice-area level. Each firm contributes one value per metric, averaged across the years it has data for. A metric has at least six firms behind it, and a firm has at least four of the five years.
Caveats: Extra revenue is valued at the 70% contribution margin and cost removed at the full amount. Figures carry around 12% of uncertainty either way. They are not additive, because several metrics price the same revenue from different directions, and they are not a projection for any individual firm.