Most law firms report the wrong social mobility data
New guidelines issued late last year aim to stop the confusion
How do you measure success when it comes to social mobility, also known as socioeconomic status?
It’s a question many firms have grappled with at some point.
Monitoring progress on gender and ethnicity is pretty straightforward by comparison. There’s a high level of consensus about how they are defined, how to collect the data, and what ‘good’ looks like: usually some combination of how your firm compares with the population, and equal outcomes in areas like recruitment, retention and work allocation.
But social mobility presents a more complex challenge: how do you measure something for which there are many definitions and no consensus yardsticks?
What metrics of social mobility do firms currently use?
We took a sample of 40 of the UK’s top law firms to understand more.
We found that the most commonly reported metric was the type of secondary school attended.
25 firms (or 96% of firms regularly reporting) in our sample were disclosing the balance of state school educated and independent school educated staff.
Number of firms in sample using each metric for regular social mobility reporting
As of December 2020
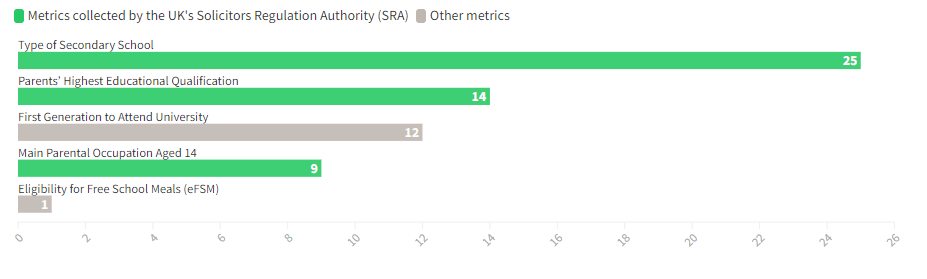
Many firms point out their reporting is in line with the UK’s Solicitors Regulation Authority , which asks firms to collect and submit data for three metrics: Type of Secondary School, Parents’ Highest Educational Qualification, and Main Parental Occupation aged 14.
While the SRA has asked for type of secondary school for several years, the other two metrics were only introduced in 2019.
Why are some social mobility metrics better than others?
Pirical’s clients are not unusual among major employers in that, faced with no clear consensus metric, they often collect and report on a combination of metrics to be safe.
Pirical has worked with many and found that most of the commonly used ones have at least one major drawback.
Summarising an extensive body of research on the subject, there are 5 criteria that determine the usefulness of a social mobility metric:
- Simple. Is the question straightforward enough to receive high response rates and unambiguous answers?
- Accurate. Do responses correlate well enough with other more detailed and academic assessments of social mobility to be a decent proxy of socioeconomic status?
- International. Is the metric applicable across many, if not most, countries?
- Multigenerational. Is the metric relevant across all age groups?
- Balanced. Does the metric account for both social advantage and social disadvantage?
| Metric collected | Description | Simple | Accurate | International | Multigenerational | Balanced |
|---|---|---|---|---|---|---|
| Postcode of teenage home / Index of multiple deprivation | The index of multiple deprivation is the official measure favoured by the UK government and the accepted ‘gold standard’ for understanding relative social status. The index is derived from the postcode of a person when they were about 14-16 years old. It incorporates income and employment levels, as well as other factors such as education and healthcare outcomes. But it has some major limitations, including but not limited to that Scotland and England have different versions that can’t be compared. And there's no international version. |
🟢 | 🟢 | ❌ | 🟢 | 🟢 |
| Parents’ Highest Educational Qualification / First generation in family to attend university | Two metrics that are thematically similar, but sometimes presented separately, that assess the education of an individual’s immediate family to determine their socioeconomic status. |
🟢 | 🟢 | ⚠️ Education provision varies by country | ⚠️ HE provision has changed over time | 🟢 |
| Eligibility for Free School Meals (eFSM) | Free School Meals are a statutory benefit available to UK school-aged children from families who receive other qualifying benefits and who have been through the relevant registration process. It does not include those who receive meals at school through other means (e.g. boarding school). Many proponents of eFSM point out that it is a quality metric that takes into account many contextual factors throughout an individuals’ school days. |
⚠️ Requires guidance | 🟢 | ⚠️ UK only | ⚠️ FSM policy introduced in 1980s | ❌ |
| Type of Secondary School Attended | In the UK, attention is often given to the balance of UK State Educated compared with UK Independent or Privately Educated employees. It is understood as a good indicator of comparative socioeconomic advantage. |
🟢 | 🟢 | ⚠️ UK only | 🟢 | ❌ |
| Paid work during school years | Recording whether an individual worked while they were studying at school. Makes a strong assumption the work was required by socioeconomic status, rather than for any other reason. |
🟢 | ❌ | 🟢 | 🟢 | ❌ |
| Paid work during University Term Time | Same as above, but for students at university and therefore only applies to graduates. |
🟢 | ❌ | 🟢 | ⚠️ Public financial support has changed over time | ❌ |
| Graduate (from any university) or not | Did the person graduate from any university at all? |
🟢 | ❌ | 🟢 | 🟢 | ❌ |
| Attended a Russell Group university | Did the person attend one of the UK’s prestigious, research-intensive universities? |
🟢 | ❌ | ❌ | 🟢 | ❌ |
| Attended Oxford or Cambridge | Did the person attend either Oxford or Cambridge, which has the reputation of being a strong signal of social advantage, despite much evidence of being a reliable metric. |
🟢 | ❌ | ❌ | 🟢 | ❌ |
What changed?
In November 2020 a consortium of organisations interested in making progress around social mobility collectively issued revised guidance on which metric should be prioritised.
The initiative was driven by the Social Mobility Commission, and backed by major players including CIPD, The Sutton Trust and the Social Mobility Foundation.
A number of major legal and professional services organisations are even represented on the steering committee including:
- BCLP
- Clifford Chance
- EY
- KPMG
- Linklaters
This revised guidance, which promotes a single, universal metric for social mobility is the biggest intervention in this space for years.
The consortium came together to extoll the benefits of collecting data about the main occupation of an individuals’ parents aged 14 , above all else.
The consortium’s guidance says this metric is the ‘single best measure to assess someone’s background’.
Main Parental Occupation Aged 14 performs well across the 5 criteria discussed above, which makes it the best proxy available to employers interested in assessing social mobility in their organisation:
| Metric | Simple | Accurate | International | Multigenerational | Balanced |
|---|---|---|---|---|---|
| Main Parental Occupation Aged 14 | 🟢 | 🟢 | 🟢 | 🟢 | 🟢 |
Main parental occupation distinguishes between higher socioeconomic status individuals, whose parents had ‘Professional’ occupations as well as those with intermediate and lower/working class occupations.
The guidance also offers a simplified question that boasts high response rates and tests well as a proxy to other, more detailed assessments of social class.
The question asks individuals to categorise their parental occupation according to a number of granular categories with examples, for example:
- Modern professional & traditional professional occupations such as: teacher, nurse, physiotherapist, social worker, musician, police officer (sergeant or above), software designer, accountant, solicitor, medical practitioner, scientist, civil / mechanical engineer.
- Senior, middle or junior managers or administrators such as: finance manager, chief executive, large business owner, office manager, retail manager, bank manager, restaurant manager, warehouse manager.
- Clerical and intermediate occupations such as: secretary, personal assistant, call centre agent, clerical worker, nursery nurse.
- Technical and craft occupations such as: motor mechanic, plumber, printer, electrician, gardener, train driver.
- Routine, semi-routine manual and service occupations such as: postal worker, machine operative, security guard, caretaker, farm worker, catering assistant, sales assistant, HGV driver, cleaner, porter, packer, labourer, waiter/waitress, bar staff.
- Long-term unemployed (claimed Jobseeker’s Allowance or earlier unemployment benefit for more than a year).
- Small business owners who employed less than 25 people such as: corner shop owners, small plumbing companies, retail shop owner, single restaurant or cafe owner, taxi owner, garage owner.
Responses are grouped and firms are encouraged to compare their results against the national benchmarks:
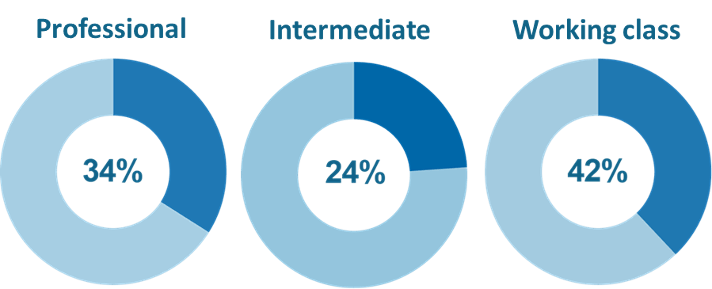
Of the firms Pirical sampled, we found only 9 (34% of firms reporting) were already using Main Parental Occupation Aged 14 for their regular reporting. The firms were:
- Charles Russell Speechlys
- DAC Beachcroft
- Fieldfisher
- Linklaters
- Macfarlanes
- Mills & Reeve
- Mishcon de Reya
- Osborne Clarke
- Travers Smith
Note this was from a selection of major firms, and so is not an exhaustive list.
What difference will this change make?
It is likely that 2021 will see a sudden shift in the number of firms reporting on this data, particularly if the SRA changes their guidance accordingly.
Those responsible for collecting and analysing their firm’s social mobility data are likely to find this guidance cuts through what has been a tricky conversation to date.
By focusing on a single metric, the guidance will reduce the need to have multiple angles of reporting, enable more benchmarking, and ultimately elevate the social mobility agenda to compare more directly with ethnicity and gender reporting.
**
Pirical On Demand (POD) is the UK’s first on demand people analytics service for HR in legal and professional services. Track your firm’s diversity and inclusion strategy with real-time data and thousands of pre-populated HR questions.
Stay up-to-date with the latest market insights and law firm rankings
Subscribe to email updates
Subscribe to content


