The Gender Blindness of our Trainee Allocation Algorithm
Or: Randomness can sometimes seem non-random
Recently, a client told us something interesting: One of the trainees her firm employs pointed out to her that all women were being allocated to a specific practice area, despite none of them having requested it.
The trainee was asking whether there was gender bias in our algorithm, given that this seemed to be impacting women specifically.
It’s important to question automation
It’s great that people are openly questioning possible biases in automation. As Artificial Intelligence eats the world, we need this kind of citizens’ vigilance to ensure that the rules we set up in good faith don’t have unexpected systemic biases built in as second or third order consequences.
So it’s excellent she raised this point. Let’s test this thoroughly.
We start from the assumption that our trainee algorithm is not gender biased.
How can we make this assumption?
Firstly, we don’t have trainees’ gender as part of our data set. Secondly, we ran some analysis to check for inherent biases.
But let’s take things one by one.
What’s in the recipe
The algorithm of Ruth , our trainee allocation tool, uses data from the firm and from the trainee. The firm provides the availability of seats, while the trainee shares their preferences on which seats they desire. The algorithm does not have access to any personal information on the trainee.
This data then gets matched with the number of available traineeships at a given firm. And this is where the Ruth algorithm comes in.
Just like the brainpower you’d have to exert to allocate seats at a wedding where difficult family relationships and venerated relatives’ preferences need to be taken into account, Ruth crunches the data and delivers an optimal result given the constraints it has to work with.
So why this skewed outcome?
How is it possible that, in the instance mentioned at the outset, all female trainees had been allocated to one particular practice area, although none of them had requested it?
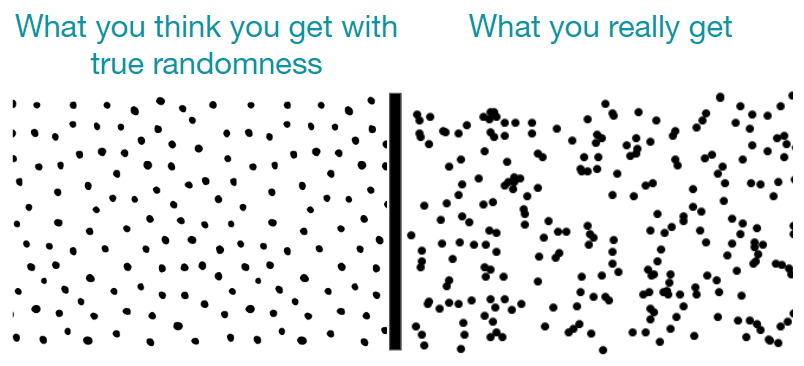
The answer lies in the power of randomness. It turns out that randomness does not mean equal distribution of outcomes.
For an illustration of this phenomenon we can turn to the shuffle mode of our music player of choice.
How randomness appears non-random
If you were to spin the Roulette wheel exactly 37 times, the ball wouldn’t land exactly once on its 37 numbers. (In fact, this specific outcome has a likelihood of 0.000000000000131%).
Similarly, if you shuffle songs on a Spotify playlist, you will not get a nice and even distribution of the songs. You think you’ll get Song 13, then Song 384, then song 122, and so on. When in reality, you could easily get a string of Song 13, then Song 14 and then Song 15 — which would make you pull out your phone and irritably check what’s happening with that damned Shuffle mode!
The designers of music apps know about this clustering phenomenon and that people are annoyed by it. That’s why most Shuffle modes are now designed to not be completely random. Instead, they have been slightly manipulated in a way so that the next song is always nicely far away from the previous one.
What this means for trainee allocation
When we designed our trainee allocation algorithm Ruth, we didn’t build in this randomness “manipulator” in order to smooth out these types of outcome clusters.
Put more vividly, we didn’t care if, on our Classic Rock playlist, the Shuffle mode played 4 Led Zeppelin songs in a row.
And this is what the trainee in this case experienced: She stumbled on one of those clusters, one of those instances where the shuffle mode played Songs 13, 14, 15 and 16 in a row. A rare occurrence indeed, but one that is just as likely that there’d be 5 men and 3 women, or 1 man and 7 women, or any other gender mix in that particular department.
But could there be inherent bias?
Lastly, we need to address the topic of inherent, or systemic, bias.
We often hear that women and men make different choices as a group. Could the skewed result in this case stem from women having made different choices as a group?
Negative. We looked at the data, specifically examining how men and women selected their choices and found no significant differences.
Conclusion
Things are often not what they seem. And, as Daniel Kahneman’s seminal book “Thinking, Fast and Slow” teaches us, it is very tempting to make a snap judgment (“System 1 thinking”) and attribute an uneven outcome to some form of error or bias in the algorithm.
It’s important to think about these issues and continuously challenge ourselves to ensure machines behave in the way we expect.
We hope that with the above, we have presented good arguments to counter the impression of error and bias.
Stay up-to-date with the latest market insights and law firm rankings
Subscribe to email updates
Subscribe to content