People Analytics demystified — Part 3: P-value
This is the third in a series of posts requested by some of our clients on demystifying concepts in analytics. It is intended to introduce analytical concepts to those without a mathematical or statistical background, in a way that is both intuitive and immediately useful.
We hope it will lead to people asking more questions about analytics and pausing to consider implications of analysis they see in their day-to-day work.
If you want to get the entire series over the next few weeks comfortably in your inbox, sign up to our newsletter .
Let’s jump right in. This week’s concept is p-value.
P-value
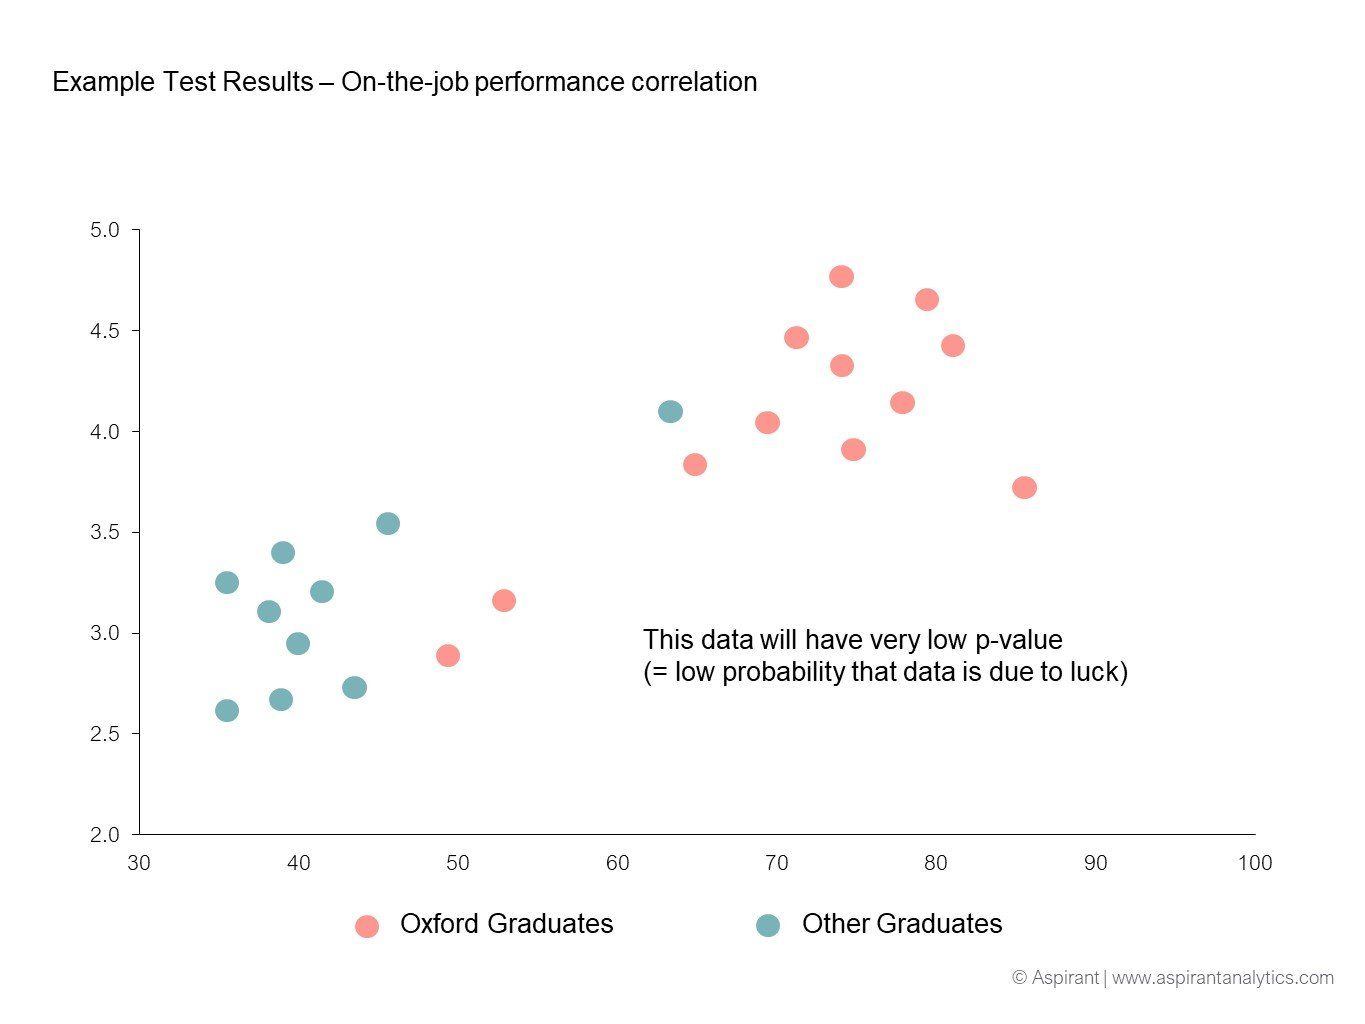
Here’s an interesting question: Say you have a team of two lawyers working with you. Brenda is an Oxford graduate, the other, Alfred, attended an average university. Brenda’s on-the-job performance score is 4.2 (out of 5.0), Alfred’s is 3.3.
Does this information allow you to conclude that Oxford graduates are better lawyers than their peers from humbler institutions? No. The sample size is far too small to make such an assertion.
However, if you have a team of 2,000 lawyers working with you, half of whom went to Oxford, the other half went to average universities, and their average performance scores are 4.2 and 3.3 respectively, it feels more likely that Oxford graduates may in fact perform better than graduates from average universities.
The question is: If I see a difference between two averages, can I assume the two groups are different?
The answer can be found in the calculation of the p-value.
What is the p-value?
P-value stands for probability value. It indicates how likely it is that a result occurred by chance alone. P-values are between 0 and 1, and the smaller the better. A p-value of 0.05 is usually considered good.
In our first example above, Brenda is outperforming Alfred. But with only 2 data points, it’s possible that Brenda is the strongest performing Oxford graduate and Alfred the lowest performer from his university. Hence, we cannot make the more general conclusion that Oxford graduates have better on-the-job performance ratings.
Our second example will likely be more conclusive: with 1,000 graduates from each group, it’s far less likely that we just happened to pick 1,000 of the best Oxford graduates AND we happened to pick 1,000 of the worst graduates from other universities.
In statistical terms, we call this difference ‘statistically significant’, meaning the outcome is unlikely to have occurred by chance alone.
Why 0.05?
0.05 means there’s only a 5% chance the outcome is by chance - it’s an arbitrary cutoff that statisticians have agreed upon. It’s the most commonly used value that indicates statistical significance, and in many areas p-values at or below 0.05 are deemed sufficient. However, in many fields such as precision engineering, p-values are required to be far smaller.
We at Pirical are often happy with a p-value of 0.1 and below. The reason is that for most analyses we do, our sample is actually the full population (aka all employees), and the total number is not very large.
So 0.1 might not be statistically perfect situation, but it should be significant enough to not be ignored
What influences p-value?
Sample size
As we indicated above, the larger your sample size, the more confident you’ll get. This is why it’s hard to make a judgment based on 2 graduates, but easy when you have 2,000.
Distribution of results
The tighter the result clusters, the more confident you will be. If 90% of Oxford graduates are within an on-the-job performance score range of 4.0 and 4.2, and 90% of non-Oxbridge candidates are between 3.1 and 3.3, the results will be clearer and p-values will be low. And the more outliers there are, the larger the p-value will become.
Extremity of outliers
Not only does the number of outliers matter, but also how far out they lie. P-values in our above example (= the probability that Oxford graduates do NOT, on average, have higher on-the-job performance ratings) would increase if, out of the 1,000 non-Cambridge graduates, 100 had 5.0, i.e. perfect on-the-job performance scores.
How is this relevant for your work?
Say you want to find out which universities to focus your recruitment efforts on. You look at the entire population of junior lawyers in your law firm, and place their university next to their on-the-job performance score and calculate on-the-job performance.
Fully acknowledging that there will be multiple variables at play here and that university will not be the only predictor, you will get a result that indicates that some universities are better than others.
Should you accept this result and focus on those universities whose graduates have a higher average on-the-job performance score? Is it a fair conclusion that those universities with the higher average on-the-job performance score are better recruiting grounds for you?
The answer is simple: Only if the p-value is lower than 0.05.
How is R-Squared different from p-value?
In last week’s blog post we covered Regression and R-Squared. So it’s a legitimate question to ask what the difference is between R-Squared and p-value?
This can be a tricky one to grasp. R-Square d shows the strength of a correlation. If it is high (closer to 1), the more likely the two factors are correlated. For example, if you ran a correlation on exercise and levels of health, you would find that people who exercise tend to be healthier.
However, you could only make this conclusion with a large enough dataset. And that’s where p-values come in. If you only had 2 healthy people who exercise, and 2 unhealthy people who don’t exercise, the R-Squared may be high, but the p-values will be low because the dataset is too small.
And that’s why it’s useful to know both figures before making a decision.
Conclusion
So next time you’re tempted to make a decision on focusing recruiting on one particular university, or to roll out an HR programme after what you consider was a successful pilot, make sure you check the p-value of the existing data set and if it is higher than 0.05, you may want to reconsider.
Next week, we will look at the topic of mean vs median and when to use which.
Sign up here to get notified when a new post comes out.
Stay up-to-date with the latest market insights and law firm rankings
Subscribe to email updates
Subscribe to content