People Analytics demystified — Part 2: Regression Analysis and R-Squared
This is the second in a series of posts requested by some of our clients on demystifying concepts in analytics. It is intended to introduce analytical concepts to those without a mathematical or statistical background, in a way that is both intuitive and immediately useful.
We hope it will lead to people asking more questions about analytics and pausing to consider implications of analysis they see in their day-to-day work.
If you want to get the entire series over the next few weeks comfortably in your inbox, sign up to our newsletter .
Let’s jump right in. This week’s concept is Regression Analysis and R-Squared.
Regression Analysis and R-Squared
Imagine you get a visit from a vendor of psychometric tests, trying to sell you their new PsyTest2019 for selecting candidates for your training contract. Doing well on the test, she says, predicts great on-the-job performance as a lawyer.
You like what the vendor is saying and decide to purchase the test. For a year, you ask your candidates to take it. All 20 trainees you end up hiring that year have taken the test, and so you start collecting their on-the-job performance ratings.
The PsyTest2019 is graded on a 0-100 scale and on-the-job performance on a 1-5 scale, with higher numbers equalling higher performance. This is your data in raw form and plotted* on a graph. (see footnote 1 if you want to know the steps in MS Excel)
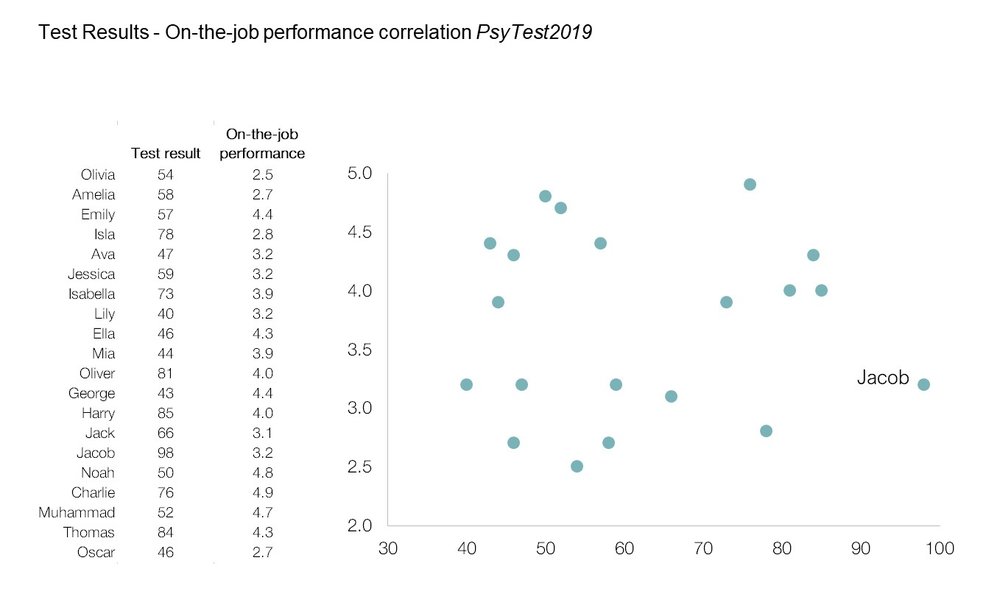
Figure 1: Results of PsyTest2019 and On-the-job performance
Each dot on the scatter plot represents a person. On the horizontal axis, you can see their test result; on the vertical axis, their on-the-job performance ratings. For example, Jacob scored 98 points on the test and his on-the-job performance rating is 3.2.
What we are looking to find out is whether an individual’s test result predicts their on-the-job performance.
How Regression Analysis can help identify predictability
We will run the regression by adding** a so-called trendline to our graph. Here, we will not discuss the details of how to mathematically calculate regression. (For an in-depth understanding of regression, watch these three videos in a row).
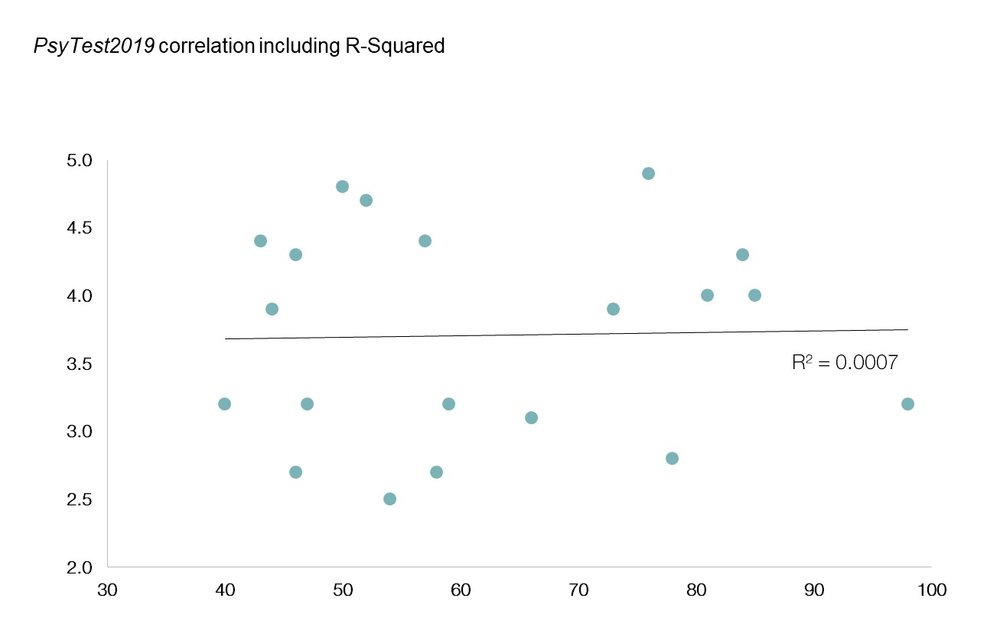
Figure 2: PsyTest2019 including Trendline and R-Squared
This trendline is very flat, which tells us one important piece of information: Wherever we go on the horizontal axis, the predicted value of on-the-job performance (the trendline’s value on the vertical axis) is always roughly 3.7. No matter if you scored a 40 or a 95 on the test, the data suggests you will always end up with an on-the-job performance rating of 3.7.
That’s not very helpful. It doesn’t allow us to conclude that someone who scored highly on PsyTest2019 will be a better lawyer than someone who scored lowly. In other words, there is no correlation between test results and on-the-job performance. If everyone’s predicted value is the same, we might as well not subject our candidates to the testing in the first place.
Mathematically, we express this level of correlation (in this case: the lack thereof) with R-Squared (R2) , a value between 0.0 and 1.0. The closer the R-Squared is to 1, the stronger the correlation. (Again, you can watch these these three videos to learn how to calculate R-Squared.)
Our R-Squared of 0.0007 is very close to 0, and such a low value means that our two variables (test scores and on-the-job performance) are not correlated.
A case of high correlation
Needless to say, you’re not very happy with the results of PsyTest2019. Running the test has not helped you identify the best candidates.
The vendor of the psychometric test comes knocking again and asks you how you have been doing. You frostily point to the data. The vendor swallows hard with a sheepish look, but then says that they have been developing a new improved model, the PsyTest2020 , and that she’d be happy if you tried it out for free. This time around, there will be correlation, she promises.
Since it’s free, you decide to try out PsyTest2020.
Another year passes, and this is your data:
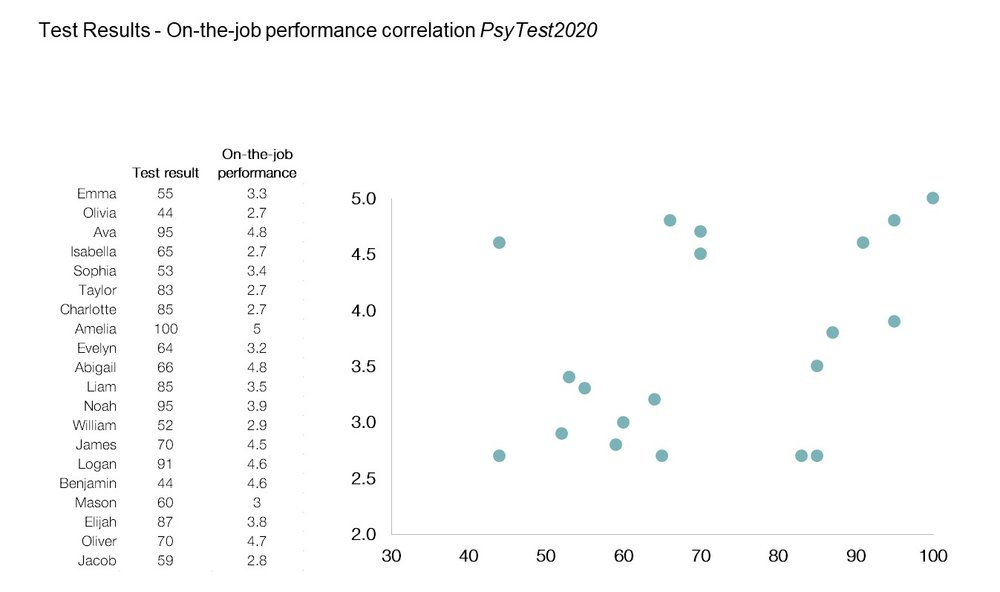
Figure 3: Results of PsyTest2020 and On-the-job performance
And again, we show our data on a scatter plot with a trendline and R-Squared.
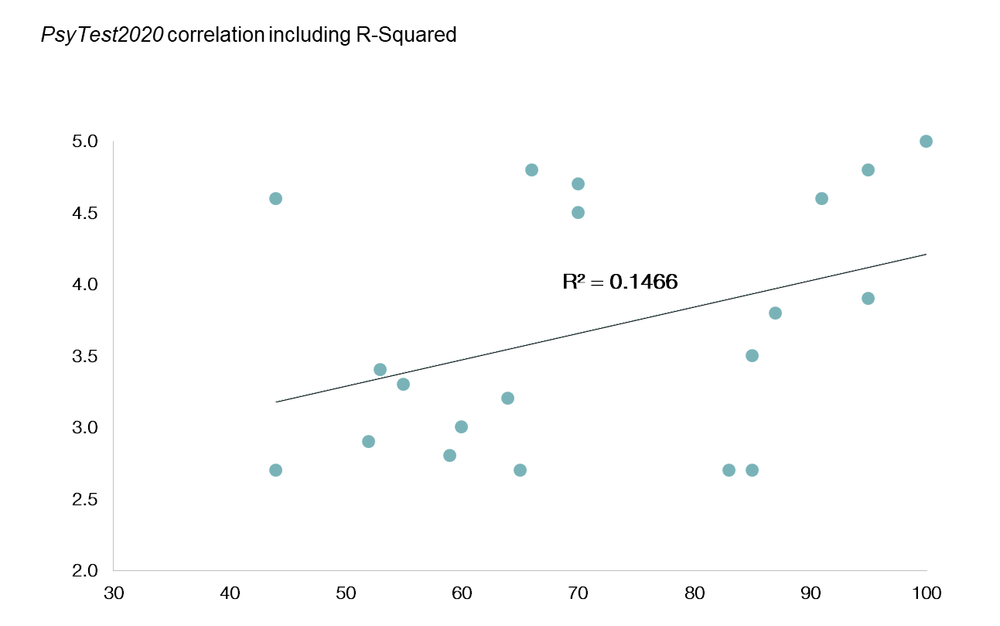
Figure 4: PsyTest2020 including Trendline and R-Squared
An R-Squared of 0.1466 means that 14.66% of a trainee’s on-the-job performance can be explained by how they scored on the test.
In contrast to the previous test, you can see how, depending on where you go on the horizontal axis, the value on the trendline (= predicted on-the-job performance) changes. For example, the predicted on-the-job performance value at test score 50 is roughly 3.3. At test score 90, it’s 4.0. That’s a significant difference.
So clearly, PsyTest2020 is better than its predecessor. But is it worth paying for in the future?
Put differently: Is an R-Squared of 0.1466 good enough? After all, the ideal is R-Squared = 1.0, and 0.1466 sounds like it’s very far away from that figure.
Interpreting R-Squared
The answer is: Yes, it is good enough.
Humans are complex creatures, and R-Squares of 0.15 and above are very hard to find in People Analytics (and Social Sciences in general). We at Pirical run regressions on People Analytics data all the time, and it’s rare we see an R-Squared higher than 0.15.
Correlation does not imply causation
Important to understand is that a high R-Squared doesn’t mean that one variable causes the other. In the case discussed above, this is clear enough — no one would assume that a good result on the psychometric test causes great on-the-job performance. It simply means that people who do well on the test are likely to be good lawyers, rather than someone who got a copy of the test and studied hard for it.
However, there are cases where people erroneously imply causation. A few interesting examples are listed here.
Conclusion
We have covered the science of linear regression and calculating R-Squared to understand the predictive value of one variable on another.
This can be very useful when analysing data sets of A-levels results and school types and whether they impact later on-the-job performance. In fact, our article about privilege, school quality and relative performance vs peers used the same kind of Regression Analysis Modelling described above.
We hope this will help you decide which interview methods are worth introducing and keeping, and which employee engagement initiatives work and which ones don’t.
Next week, we will cover the important concept of p-values which help you understand when a small data set has enough predictive value.
Sign up here to get notified when a new post comes out.
Footnotes — Excel instructions:
(1) How to build a scatter plot in MS Excel 2007: Highlight the two columns containing the data, excluding the column with the names. Click Insert in the top menu, and click the scatter plot icon in the Charts sub-menu:
(2) How to add a Trendline to a scatter plot:
Left-click on the graph and in the top menu click Design —> Add Chart Element —> Trendline —> Linear.
(3) How to add R-Squared to the graph:
We can add R2 into the graph by right-clicking on the Trendline, selecting Format Trendline and then ticking the “Display R-squared value on chart” box.
Stay up-to-date with the latest market insights and law firm rankings
Subscribe to email updates
Subscribe to content