How To Control Access To Sensitive HR Data
As more users have access to self-serve from your firm’s HR data, how can you make sure commercially or personally sensitive data is protected? In this tutorial we will explain the privileging system in Pirical On Demand (POD).
Pirical On Demand is a library of over 1,000 tried-and-tested analyses, kept up to date with your firm’s data. HR professionals use POD to benchmark statistics against competitors, to analyse bias in recruitment and work allocation systems, and for real-time or predictive capabilities like highlighting which employees may need extra support. POD addresses all core diversity traits: Gender, Ethnicity, Social Mobility, Sexual Orientation, Disability, Age, and Religion.
Privileging is by datasets
An analysis in POD may use one or multiple datasets to answer a question.
Each dataset can be restricted, so only certain individuals can see analyses using that type of data.
A POD user can have any of the following privileges:
- Headcount. Can see active headcount data, including joiners and leavers.
- Diversity. Can see analyses using any diversity data (e.g. Gender, Ethnicity, LGBT+).
- Disclosive Diversity Data. If
small group anonymity protections are applied across the account, individuals with this privilege will be able to see screens where the protections can be removed. For example, the 'Survey Filler' screen offers the ability to see small groups.
- Finance. Can see analyses looking at utilisation & hours, as well as revenues, discounts and write-offs. Also includes client names.
- Compensation. Can see analyses using salary and bonus data.
- Absences. Can see analyses using absences data (e.g. holiday, sick leave, parental).
- Individual Compensation. Can see analyses that show individual salaries and bonus data (including names).
- Individuals. Can see analyses that show individuals (including their names and reasons for leaving). Importantly, does not reveal diversity data for individuals. May however include diversity data completeness for individuals (i.e. whether value is 'Known' or 'Unknown'). Does not grant access to see individual compensation (for this, a user needs the Individual Compensation tag).
- Performance. Can see analyses that show utilisation and performance rating data.
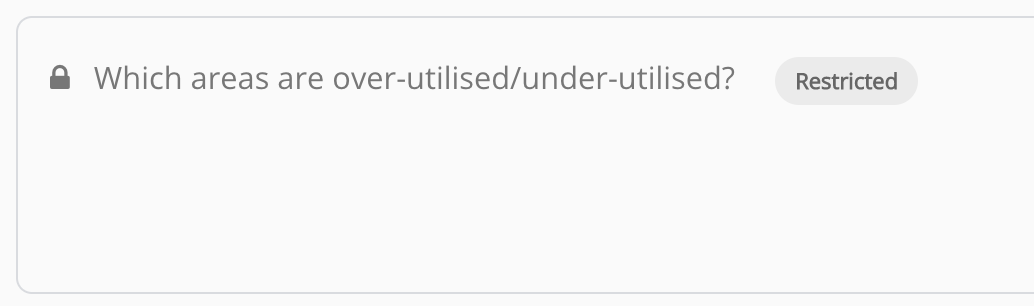
What if an analysis uses multiple datasets?
Many analyses in POD combine multiple datasets. If multiple datasets are used, a user needs to have all of the privileges associated with the analysis to see it.
For example, an analysis of utilisation by gender will appear restricted to users who have not been given privileges to see both Diversity and Performance datasets .
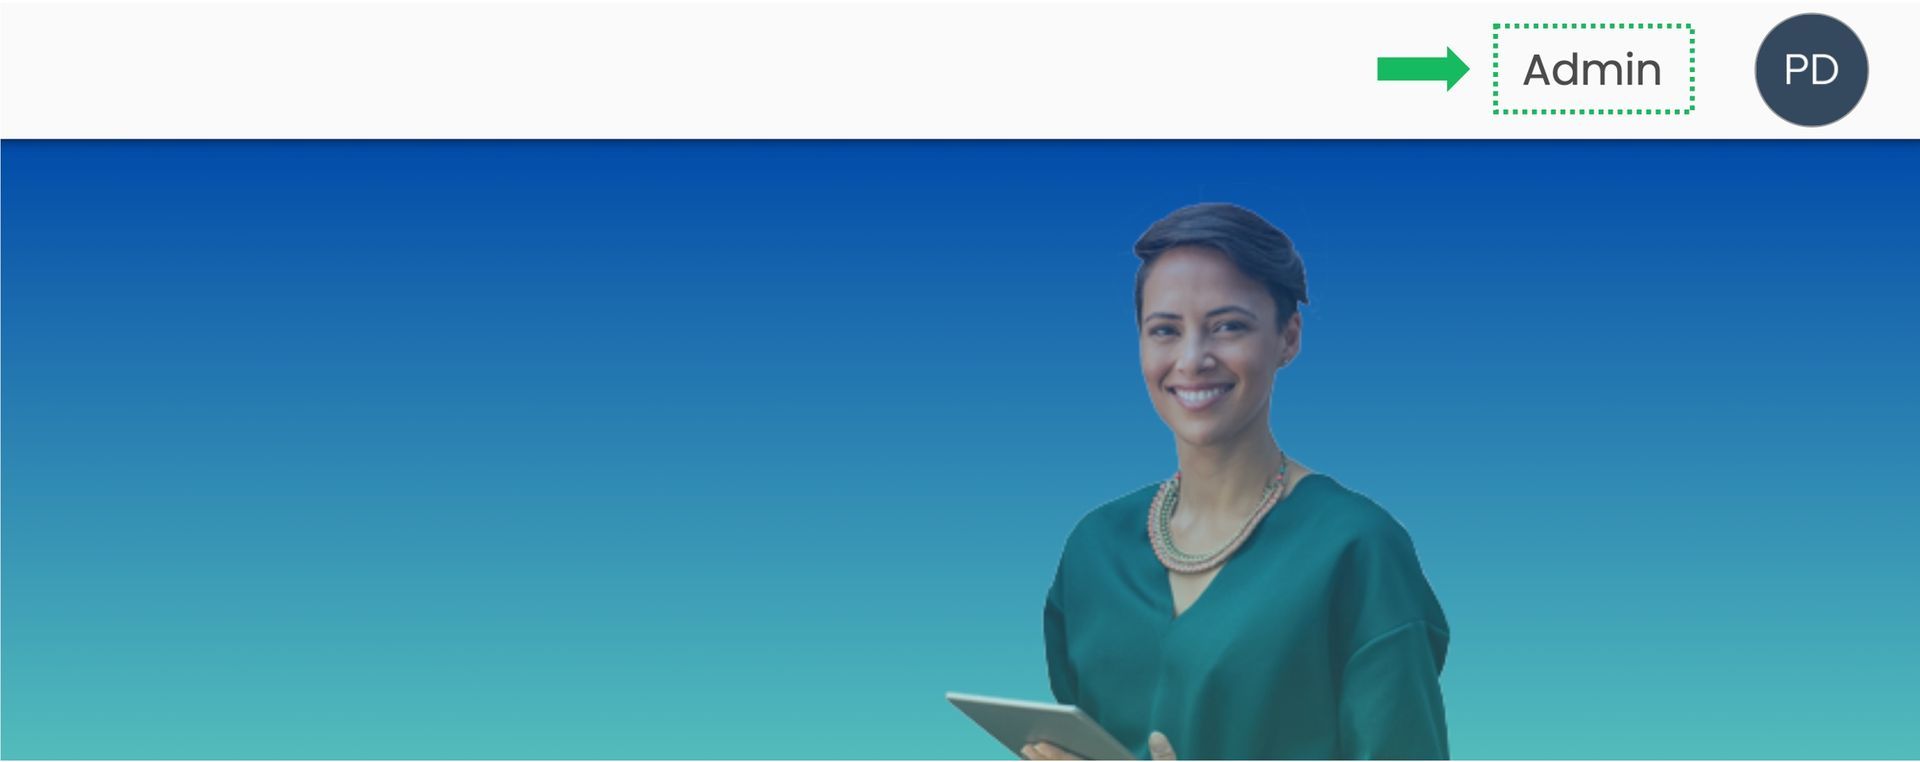
Who can manage privileges?
The manage privileges feature is only visible to selected users, called admins. By default it will only be available to account owners. Other users can be set up as admins on request.
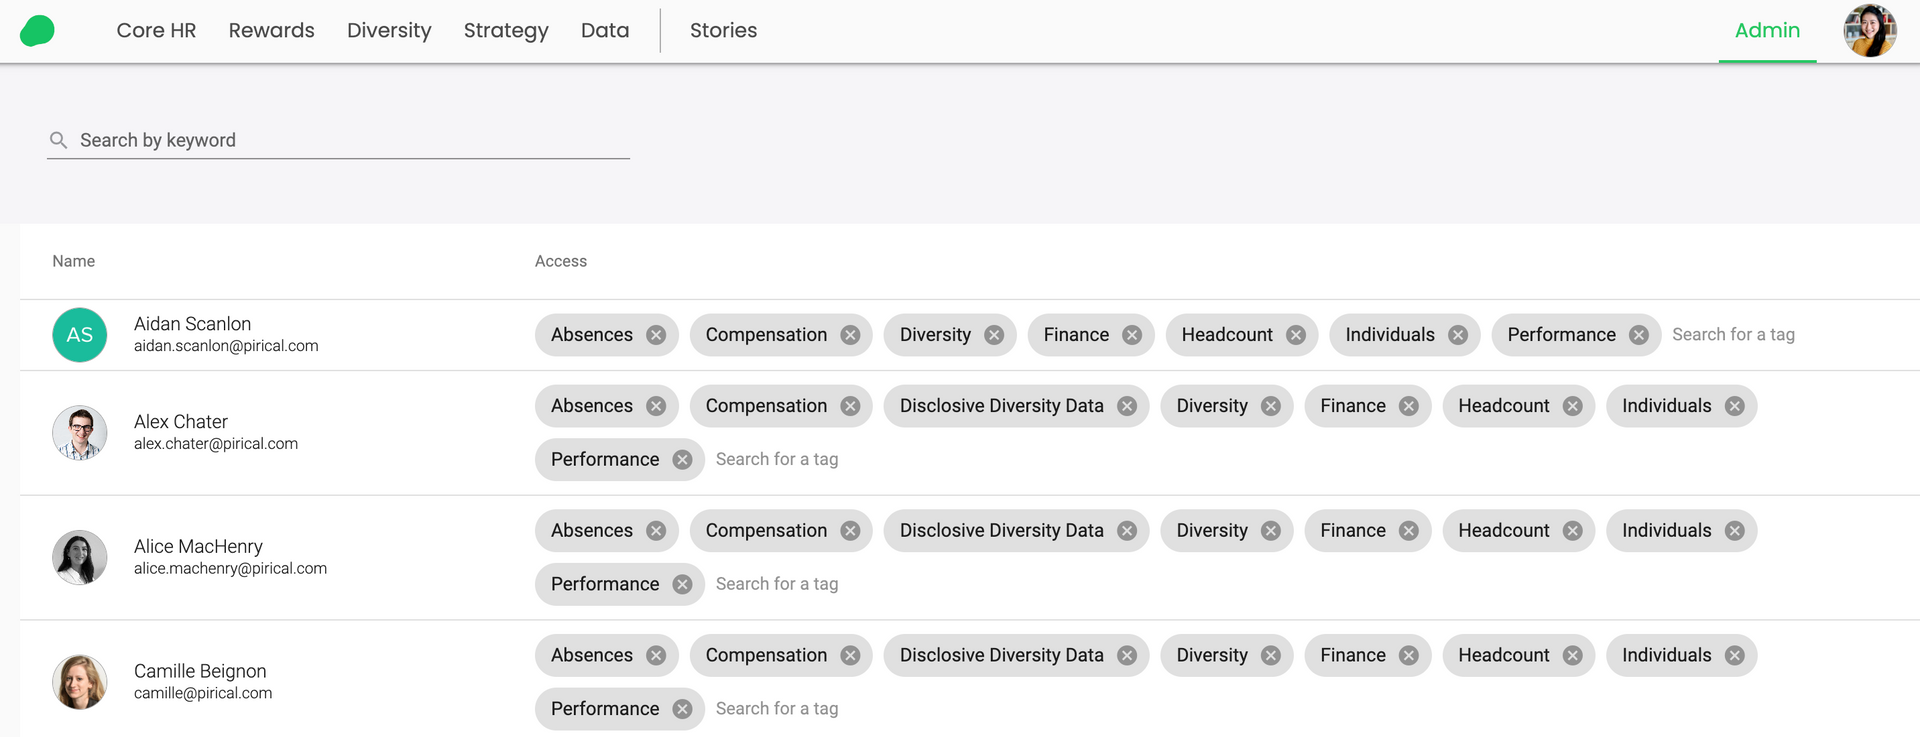
The feature can be found on the top right-hand-side of the POD site.
All active POD users are visible from this screen, and their privileging tags can be set.
Not yet a Pirical On Demand customer?
Explore the demo today to see the power of On Demand.
Contact Us
Stay up-to-date with the latest market insights and law firm rankings
Subscribe to email updates
Subscribe to content


