How To Handle Unknown Or 'Prefer Not To Say' Diversity Data
When analysing or reporting on diversity data, two cases are important to consider:
- Individuals who haven’t been asked or did not respond -> Unknown
- Individuals who decided not to participate -> Prefer Not To Say (PNS)
A common confusion is how to analyse these records.
Do not include them
It’s important to only consider individuals with known diversity characteristics; including unknowns will actually understate how diverse your organisation is.
Here’s an example. This organisation has 176 individuals, of which 23 are Unknown/PNS. To say 17% of their staff are Black would be underreporting their diversity. They would be saying they are less diverse than they actually are. The actual figure is 30 out of 153 = 20%.
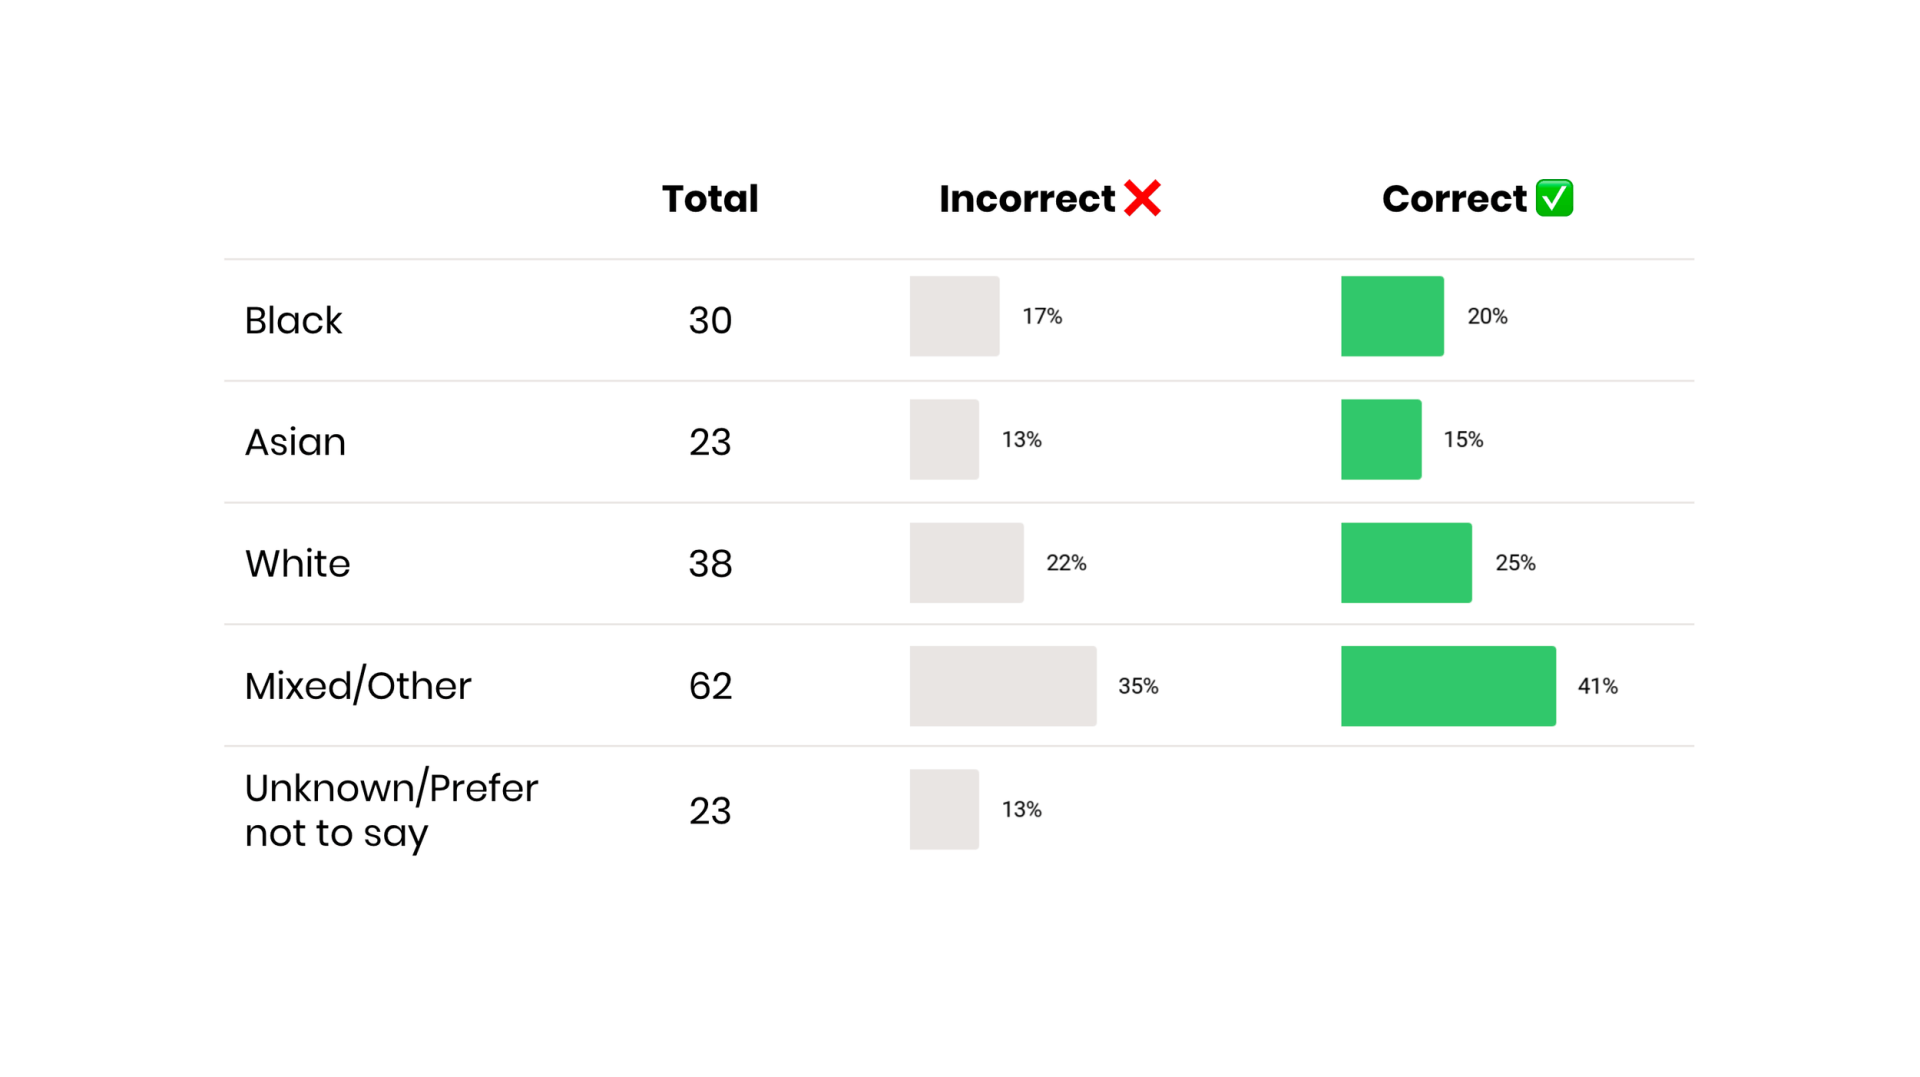
Including the Unknown/Prefer not to say values misrepresents the percentage of employees in each ethnicity category.
In practice, excluding Unknown/PNS values is the same as assuming they will be distributed in the same way as the known values. In our example, we can expect 20% of the 23 to be Black.
It’s worth noting there is no consensus that individuals who choose not to fill in diversity surveys or respond 'Prefer Not To Say’ will skew one way or another, so no correction is required.
Be clear they are excluded
Include the total numbers of Unknown/PNS to make clear people are not missing from your sample, but you are instead missing some diversity data about them.
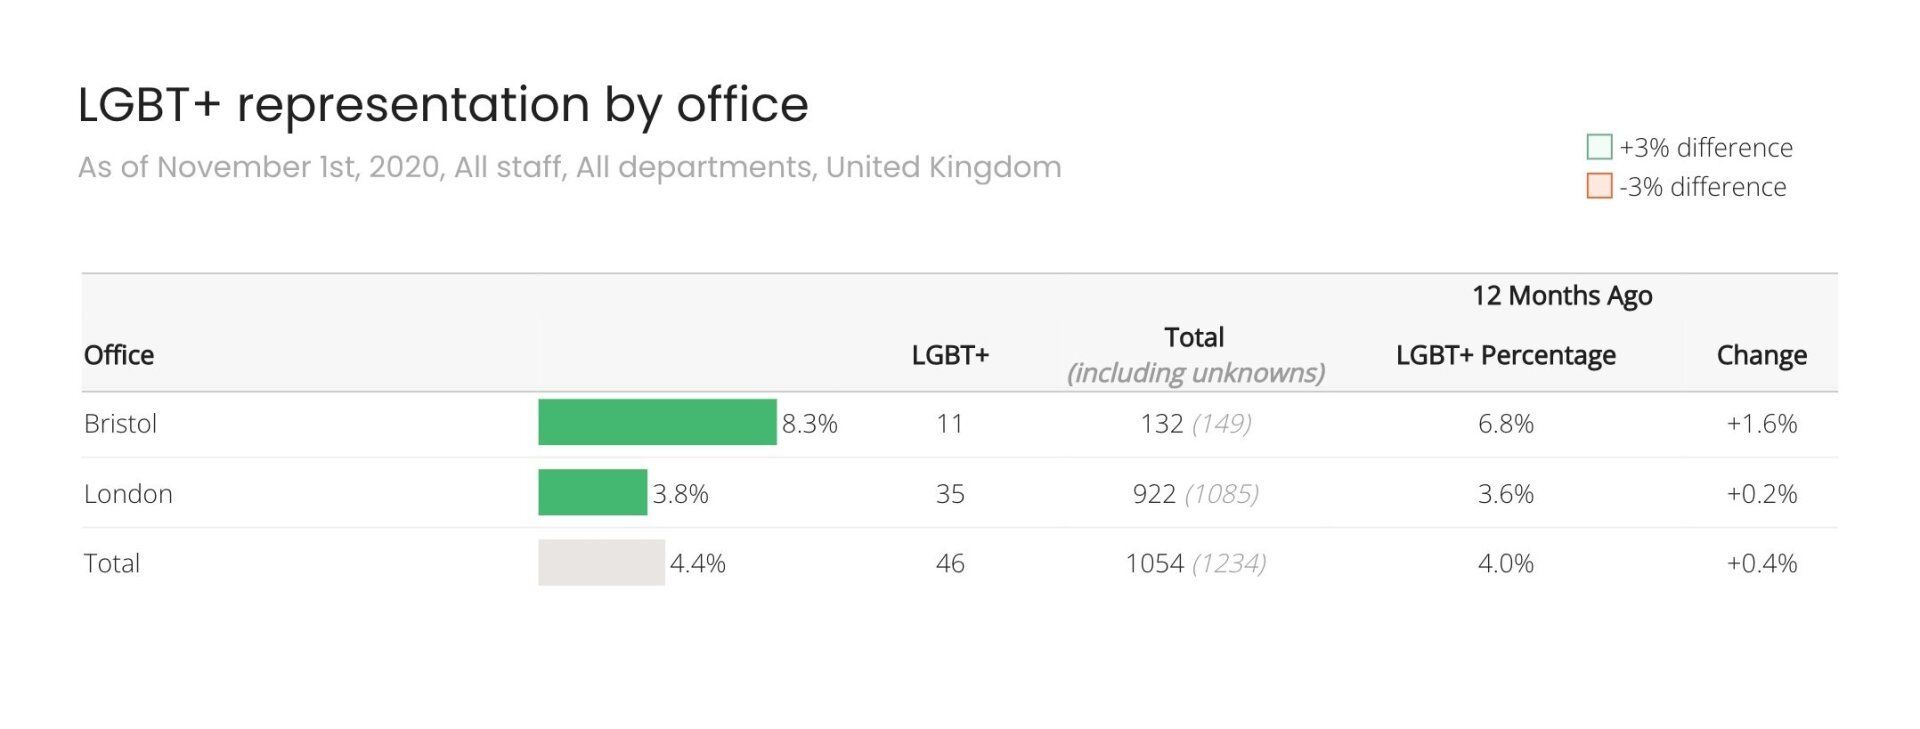
The number of Unknown / Prefer Not To Say responses should not change the result, it is a measure of uncertainty
It’s good to understand what Unknown/PNS values represent. They aren’t a category in themselves but actually represent a margin of error. The way to think about this is: the ‘true’ value lies somewhere within this range, but we’re not sure exactly where.
If everyone has responded and no one has said ‘Prefer not to say’ (100% data completeness), the margin of error would be zero. The more Unknown/PNS, the larger the margin of error.
The technical way to report on these representation figures would be to state them with a ±%, for example, 20±2%
Here's a worked example:
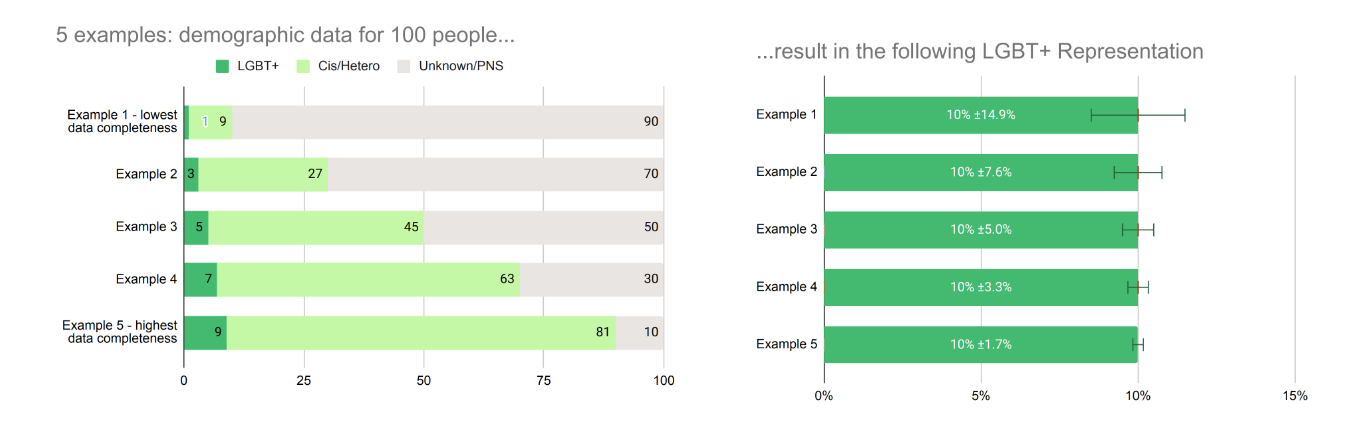
More Unknowns mean we can have less confidence about exactly where the ‘true’ value lies. Technical note: error calculated at 90% confidence interval.
It’s generally not necessary to report in this level of detail for people analytics. Pirical’s advice is keep an eye on your data completeness levels. Anything above 60-70% is enough to get reliable insights.
Statistical testing takes into account smaller samples
Analyses in Pirical On Demand can offer an additional layer of insight to determine whether you have enough data to have confidence in the conclusion.
Higher levels of Unknown/PNS values can reduce your level of confidence in the data. Our primer on R^2 and p-values will help you understand more.
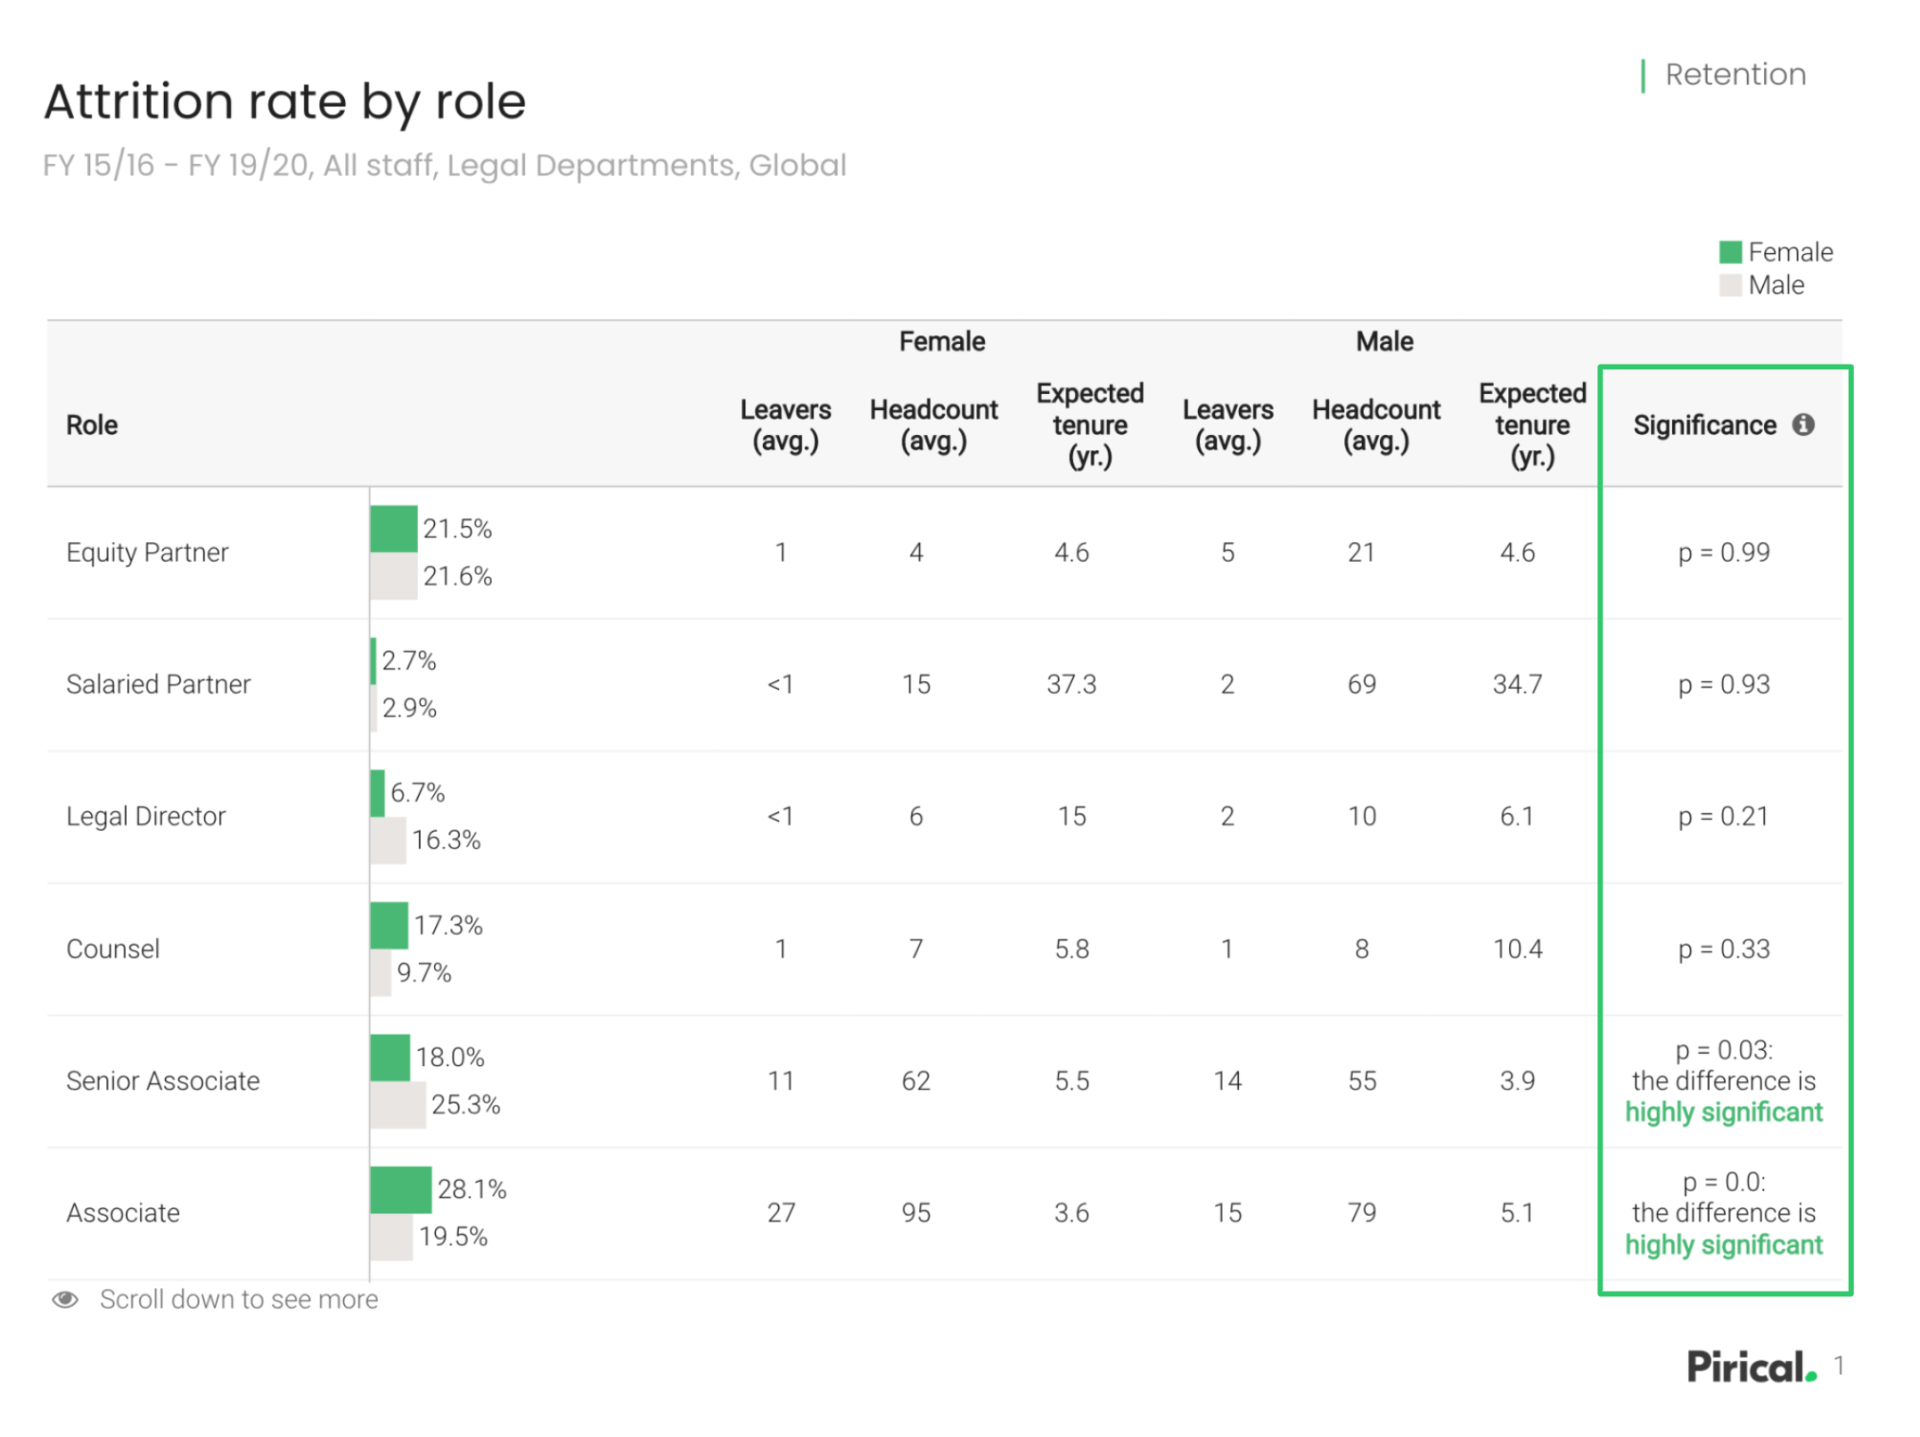
Pirical On Demand will highlight when p is less than 0.1. p is a number between 0 and 1 which indicates the likelihood that results occurred by chance. Generally speaking, the smaller the p-value, the more solid the result.
Stay up-to-date with the latest market insights and law firm rankings
Subscribe to email updates
Subscribe to content


