How working class lawyers get in and get on at large UK law firms
The following case study was presented by Pirical at an event in October 2022.
It is based on a real law firm's data. The firm is large, with over 600 Fee Earners in the UK. The data comes directly from the firm's HR system.
Pirical On Demand helps people leaders conduct this analysis themselves by self-serving from the firm's live data.
We're using Main Parental Occupation Aged 14 to analyse Socioeconomic Background (SEB)
The UK government's Social Mobility Commission recommends this metric as the "single best measure to assess someone's background".
The question asked is: "What was the occupation of your main household earner when you were aged about 14?"
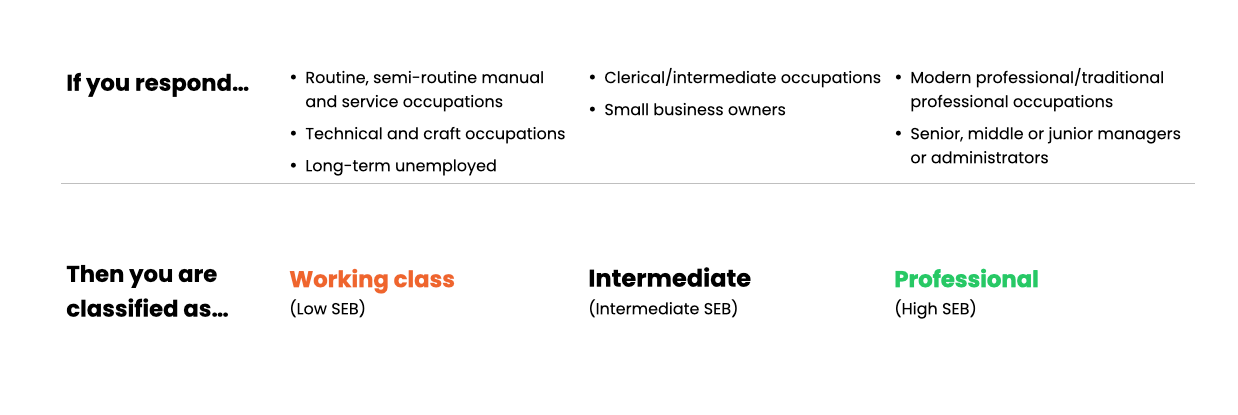
We will drop Intermediate SEB and compare Low SEB directly to High SEB. There are relatively few people in the Intermediate category. Including it adds noise and complexity.
Some people prefer the label 'Working Class' instead of 'Low SEB', and 'Professional' instead of 'High SEB'. We will use 'Low/High SEB' in this analysis to be clear we have excluded the intermediate category, which contain occupations some may consider Working Class.
The firm in our case study has about 50% data completeness for parental occupation data. This is enough to get good insights.
Using parental occupation as our primary measure of socioeconomic background is supported by a host of government, campaigning and research organisations, as well as large employers.
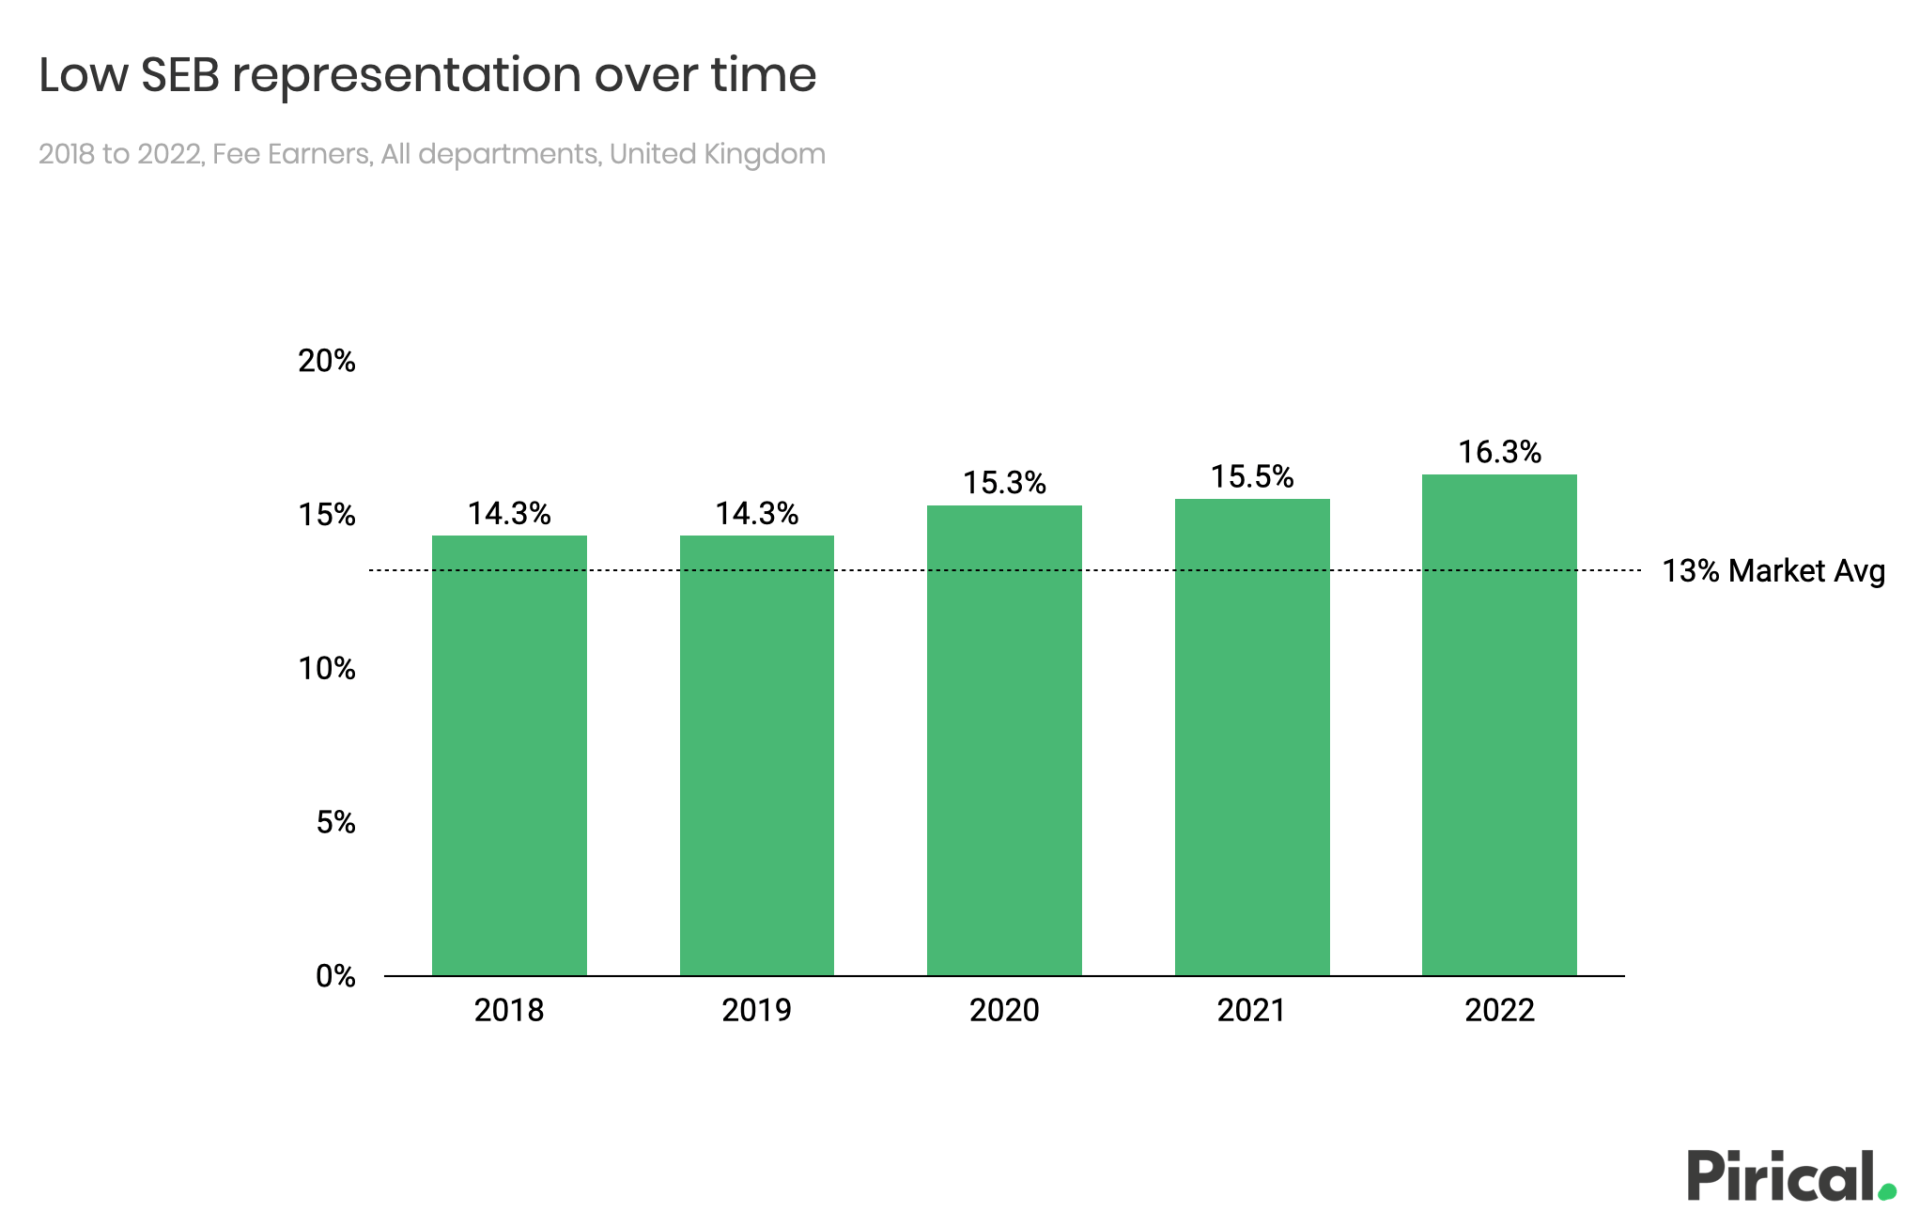
The % of Low SEB Fee Earners has been increasing slightly, and is above market average.
The market average for 2022 is 13%. The market average is calculated across firms using Pirical On Demand.
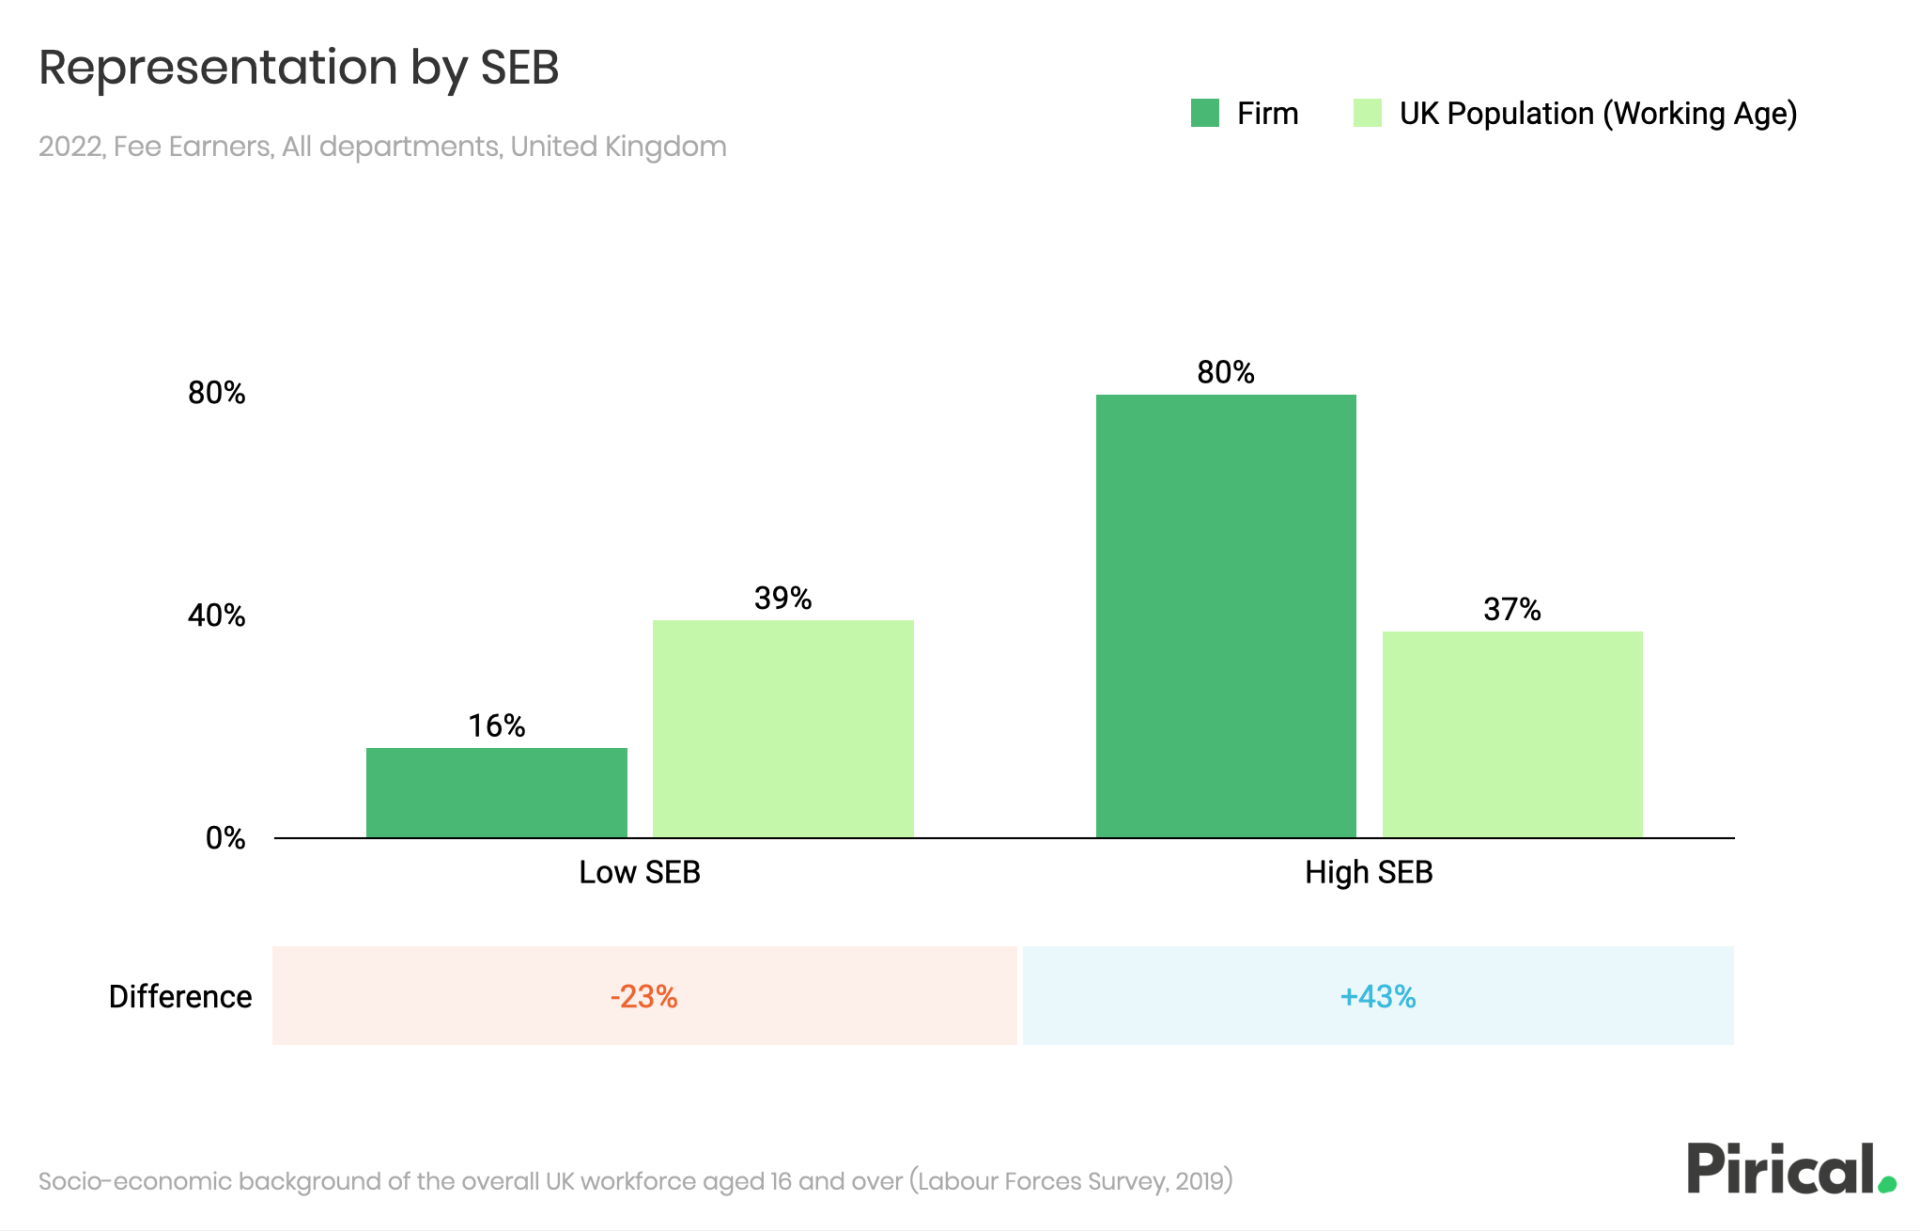
The firm has 23% fewer Low SEB Fee Earners than would be expected if drawing randomly from the UK working age population.
The firm has 80% High SEB Fee Earners, 43% more than the population.
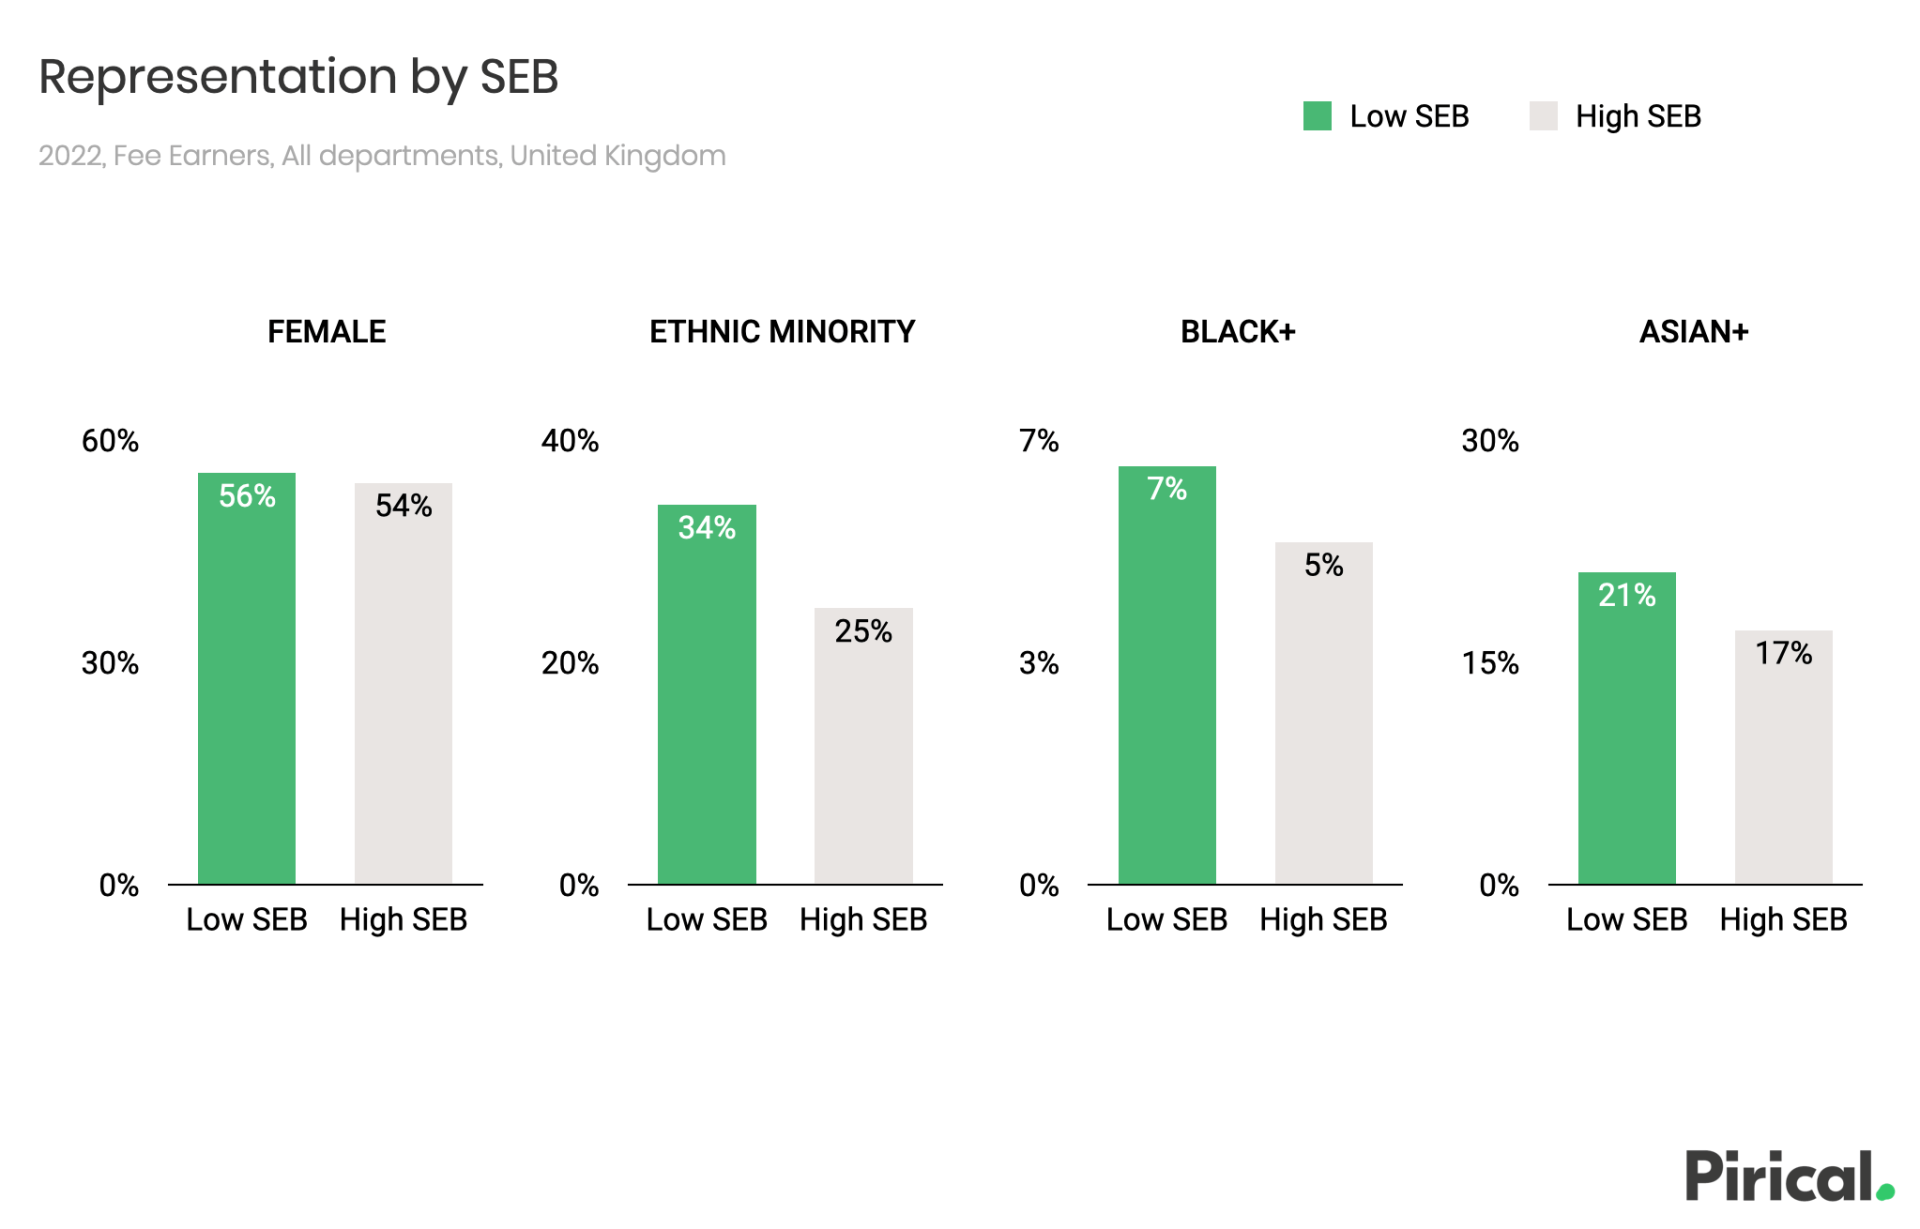
Low SEB Fee Earners are more likely to be from ethnic minorities.
Ethnic minority includes Black, Asian and Mixed/Other Minority ethnicities. 'Black+' includes Black & Mixed Black ethnicities. Same for Asian.
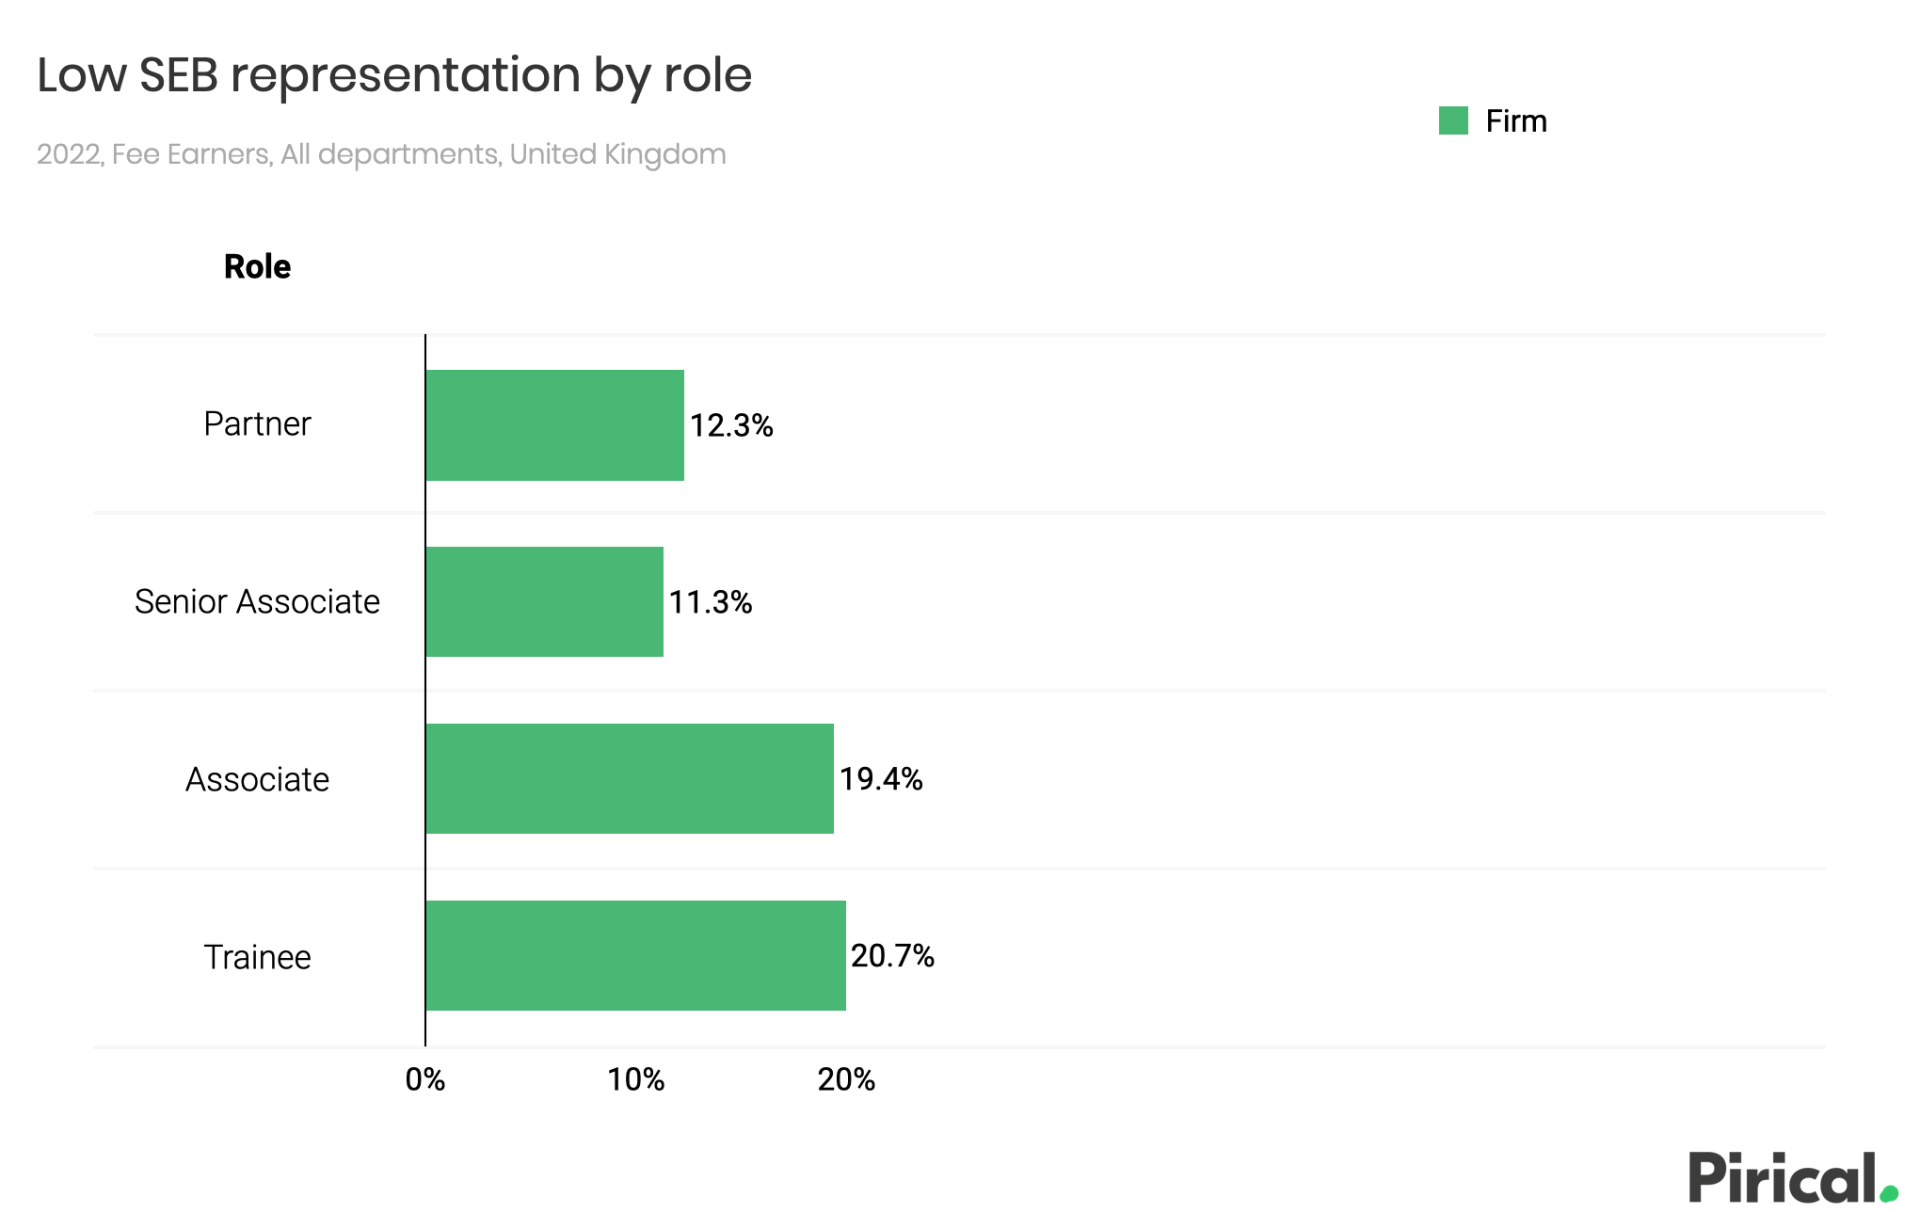
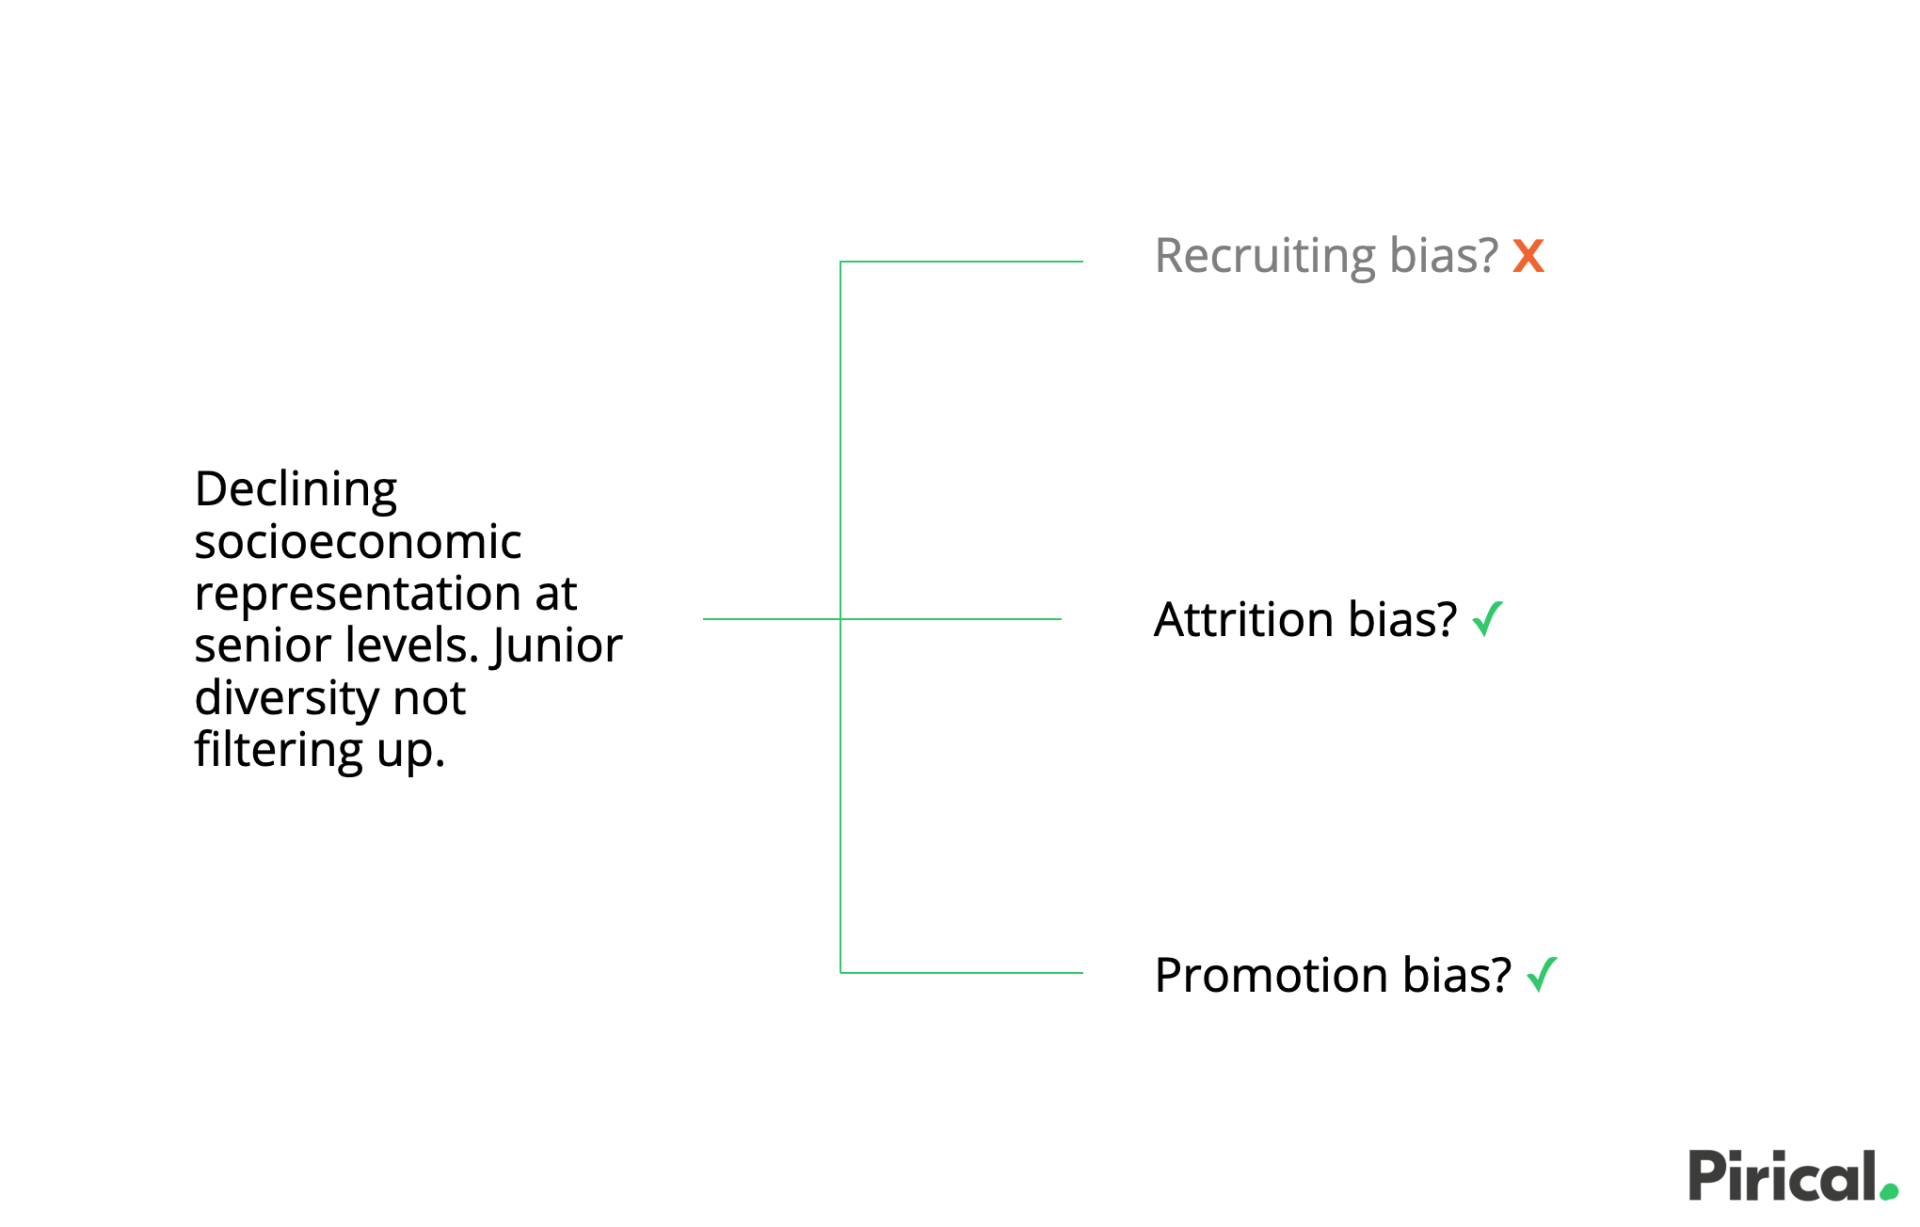
There is a pyramid: the firm’s socioeconomic diversity declines with seniority.
The percentage of Low SEB partners is actually higher than might be expected. One suggestion is that this is due to age, and how UK society has changed over time (the implication is fewer people work in manual and service occupations today than 50+ years ago). Pirical is keen to explore this further as more parental occupation benchmarks are made public.
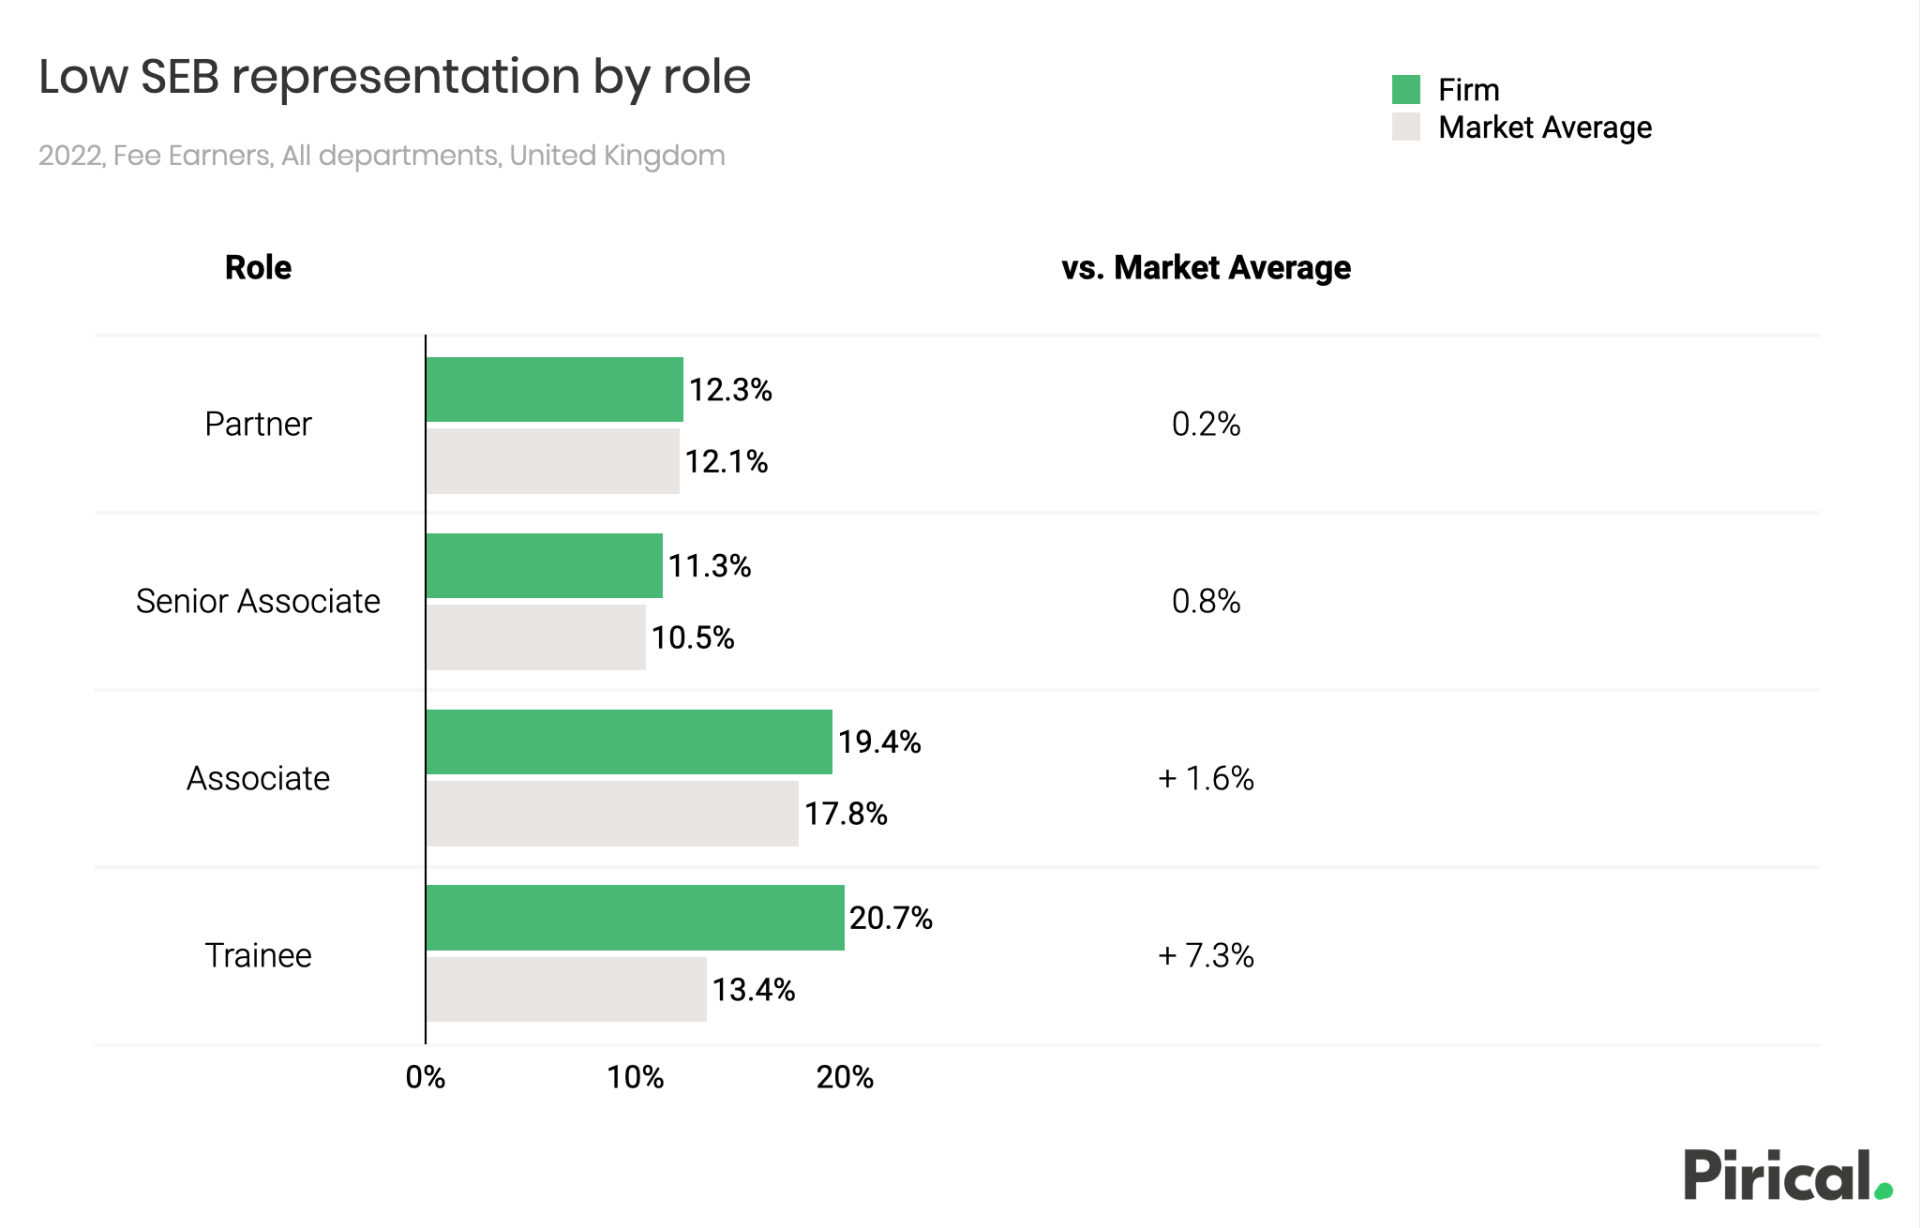
The firm’s diversity exceeds market average for junior roles.
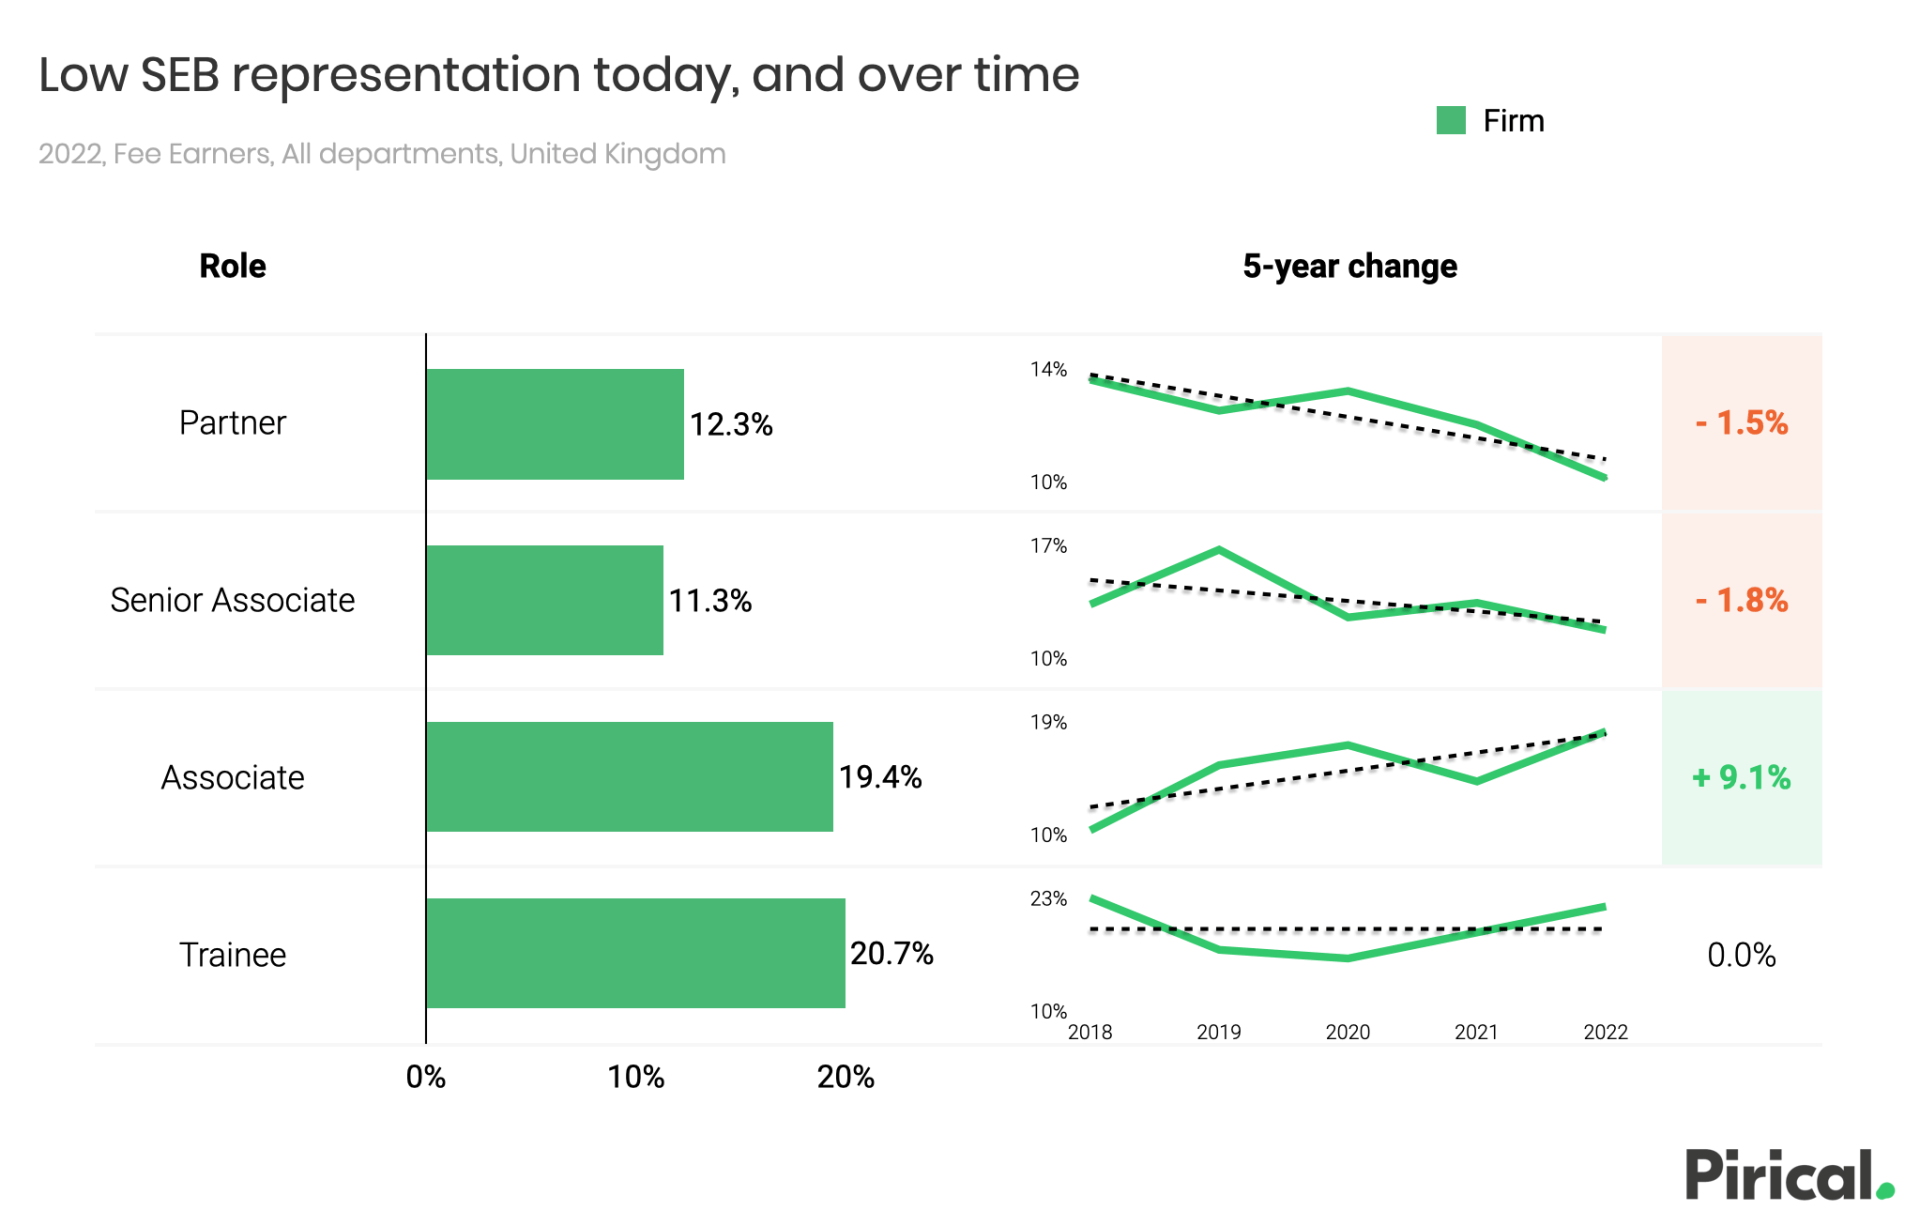
Diversity in senior roles has been decreasing, despite a diversity increase in junior roles.
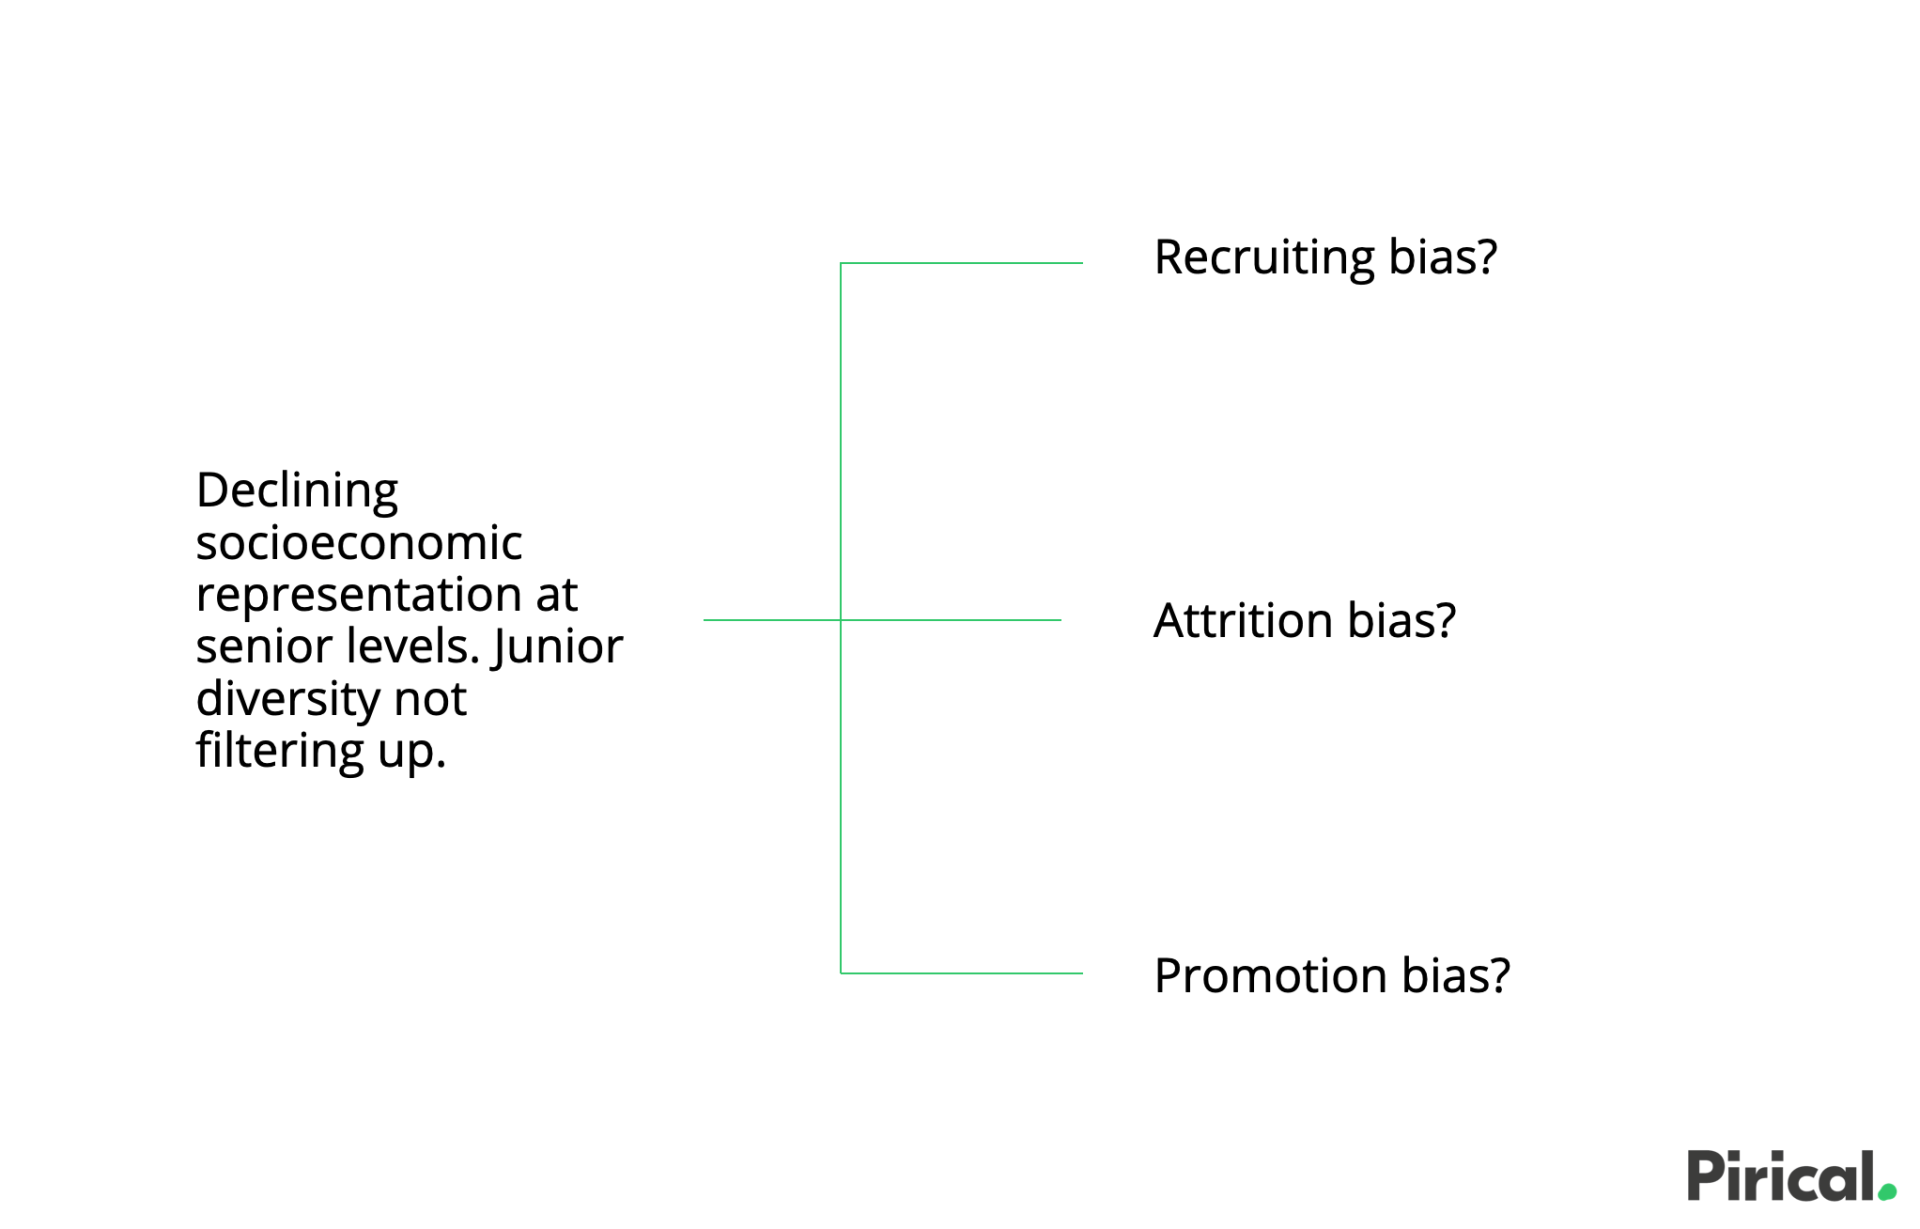
What’s happening?
There seems to be an issue with the pipeline: how talent is progressing through the firm.
There are three issues to investigate:
- Who is coming in: recruitment
- Who is going out: attrition
- How people are moving up through the pipeline: promotion
The recruitment team seems to be doing OK - not obviously a recruitment issue.
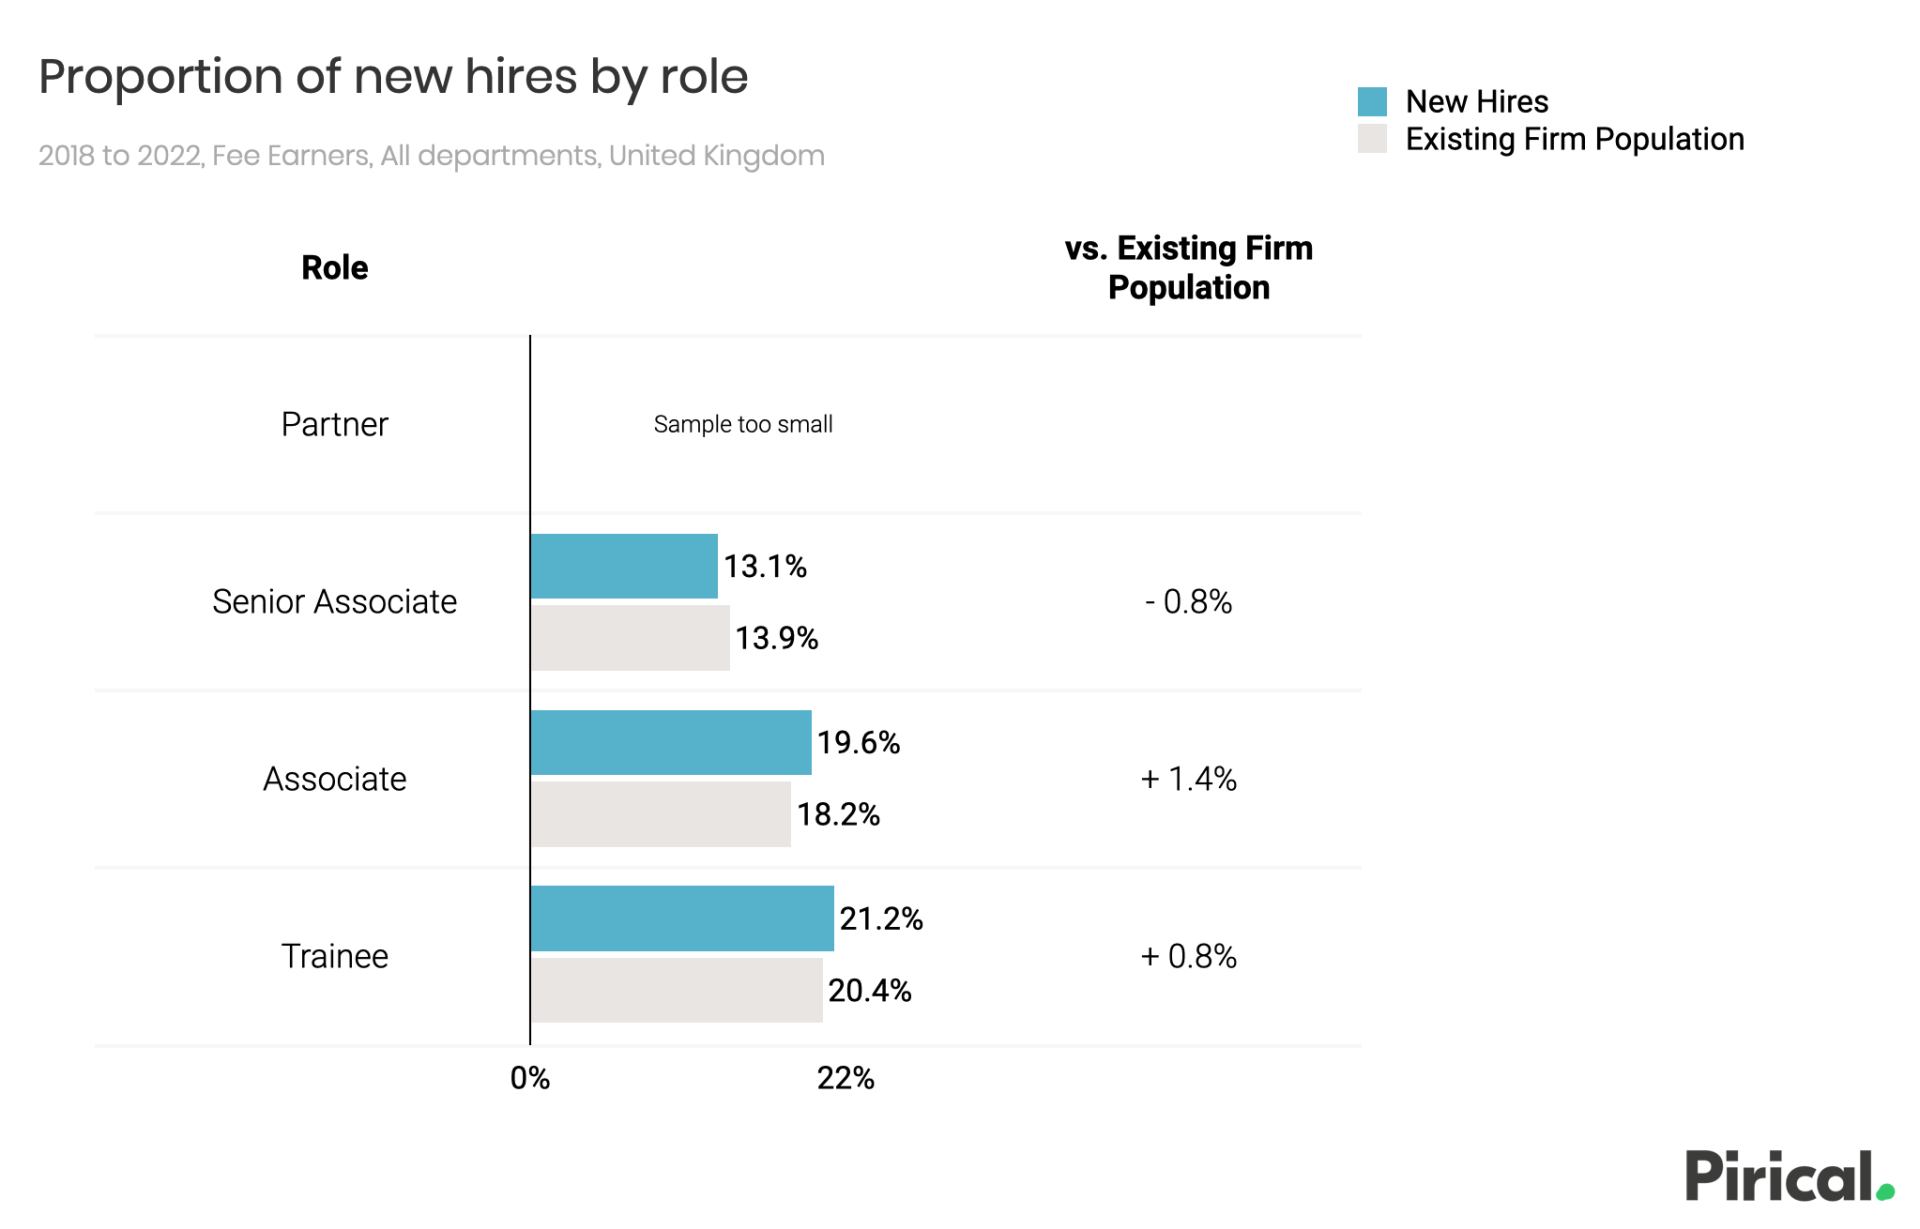
We can rule out recruiting bias.

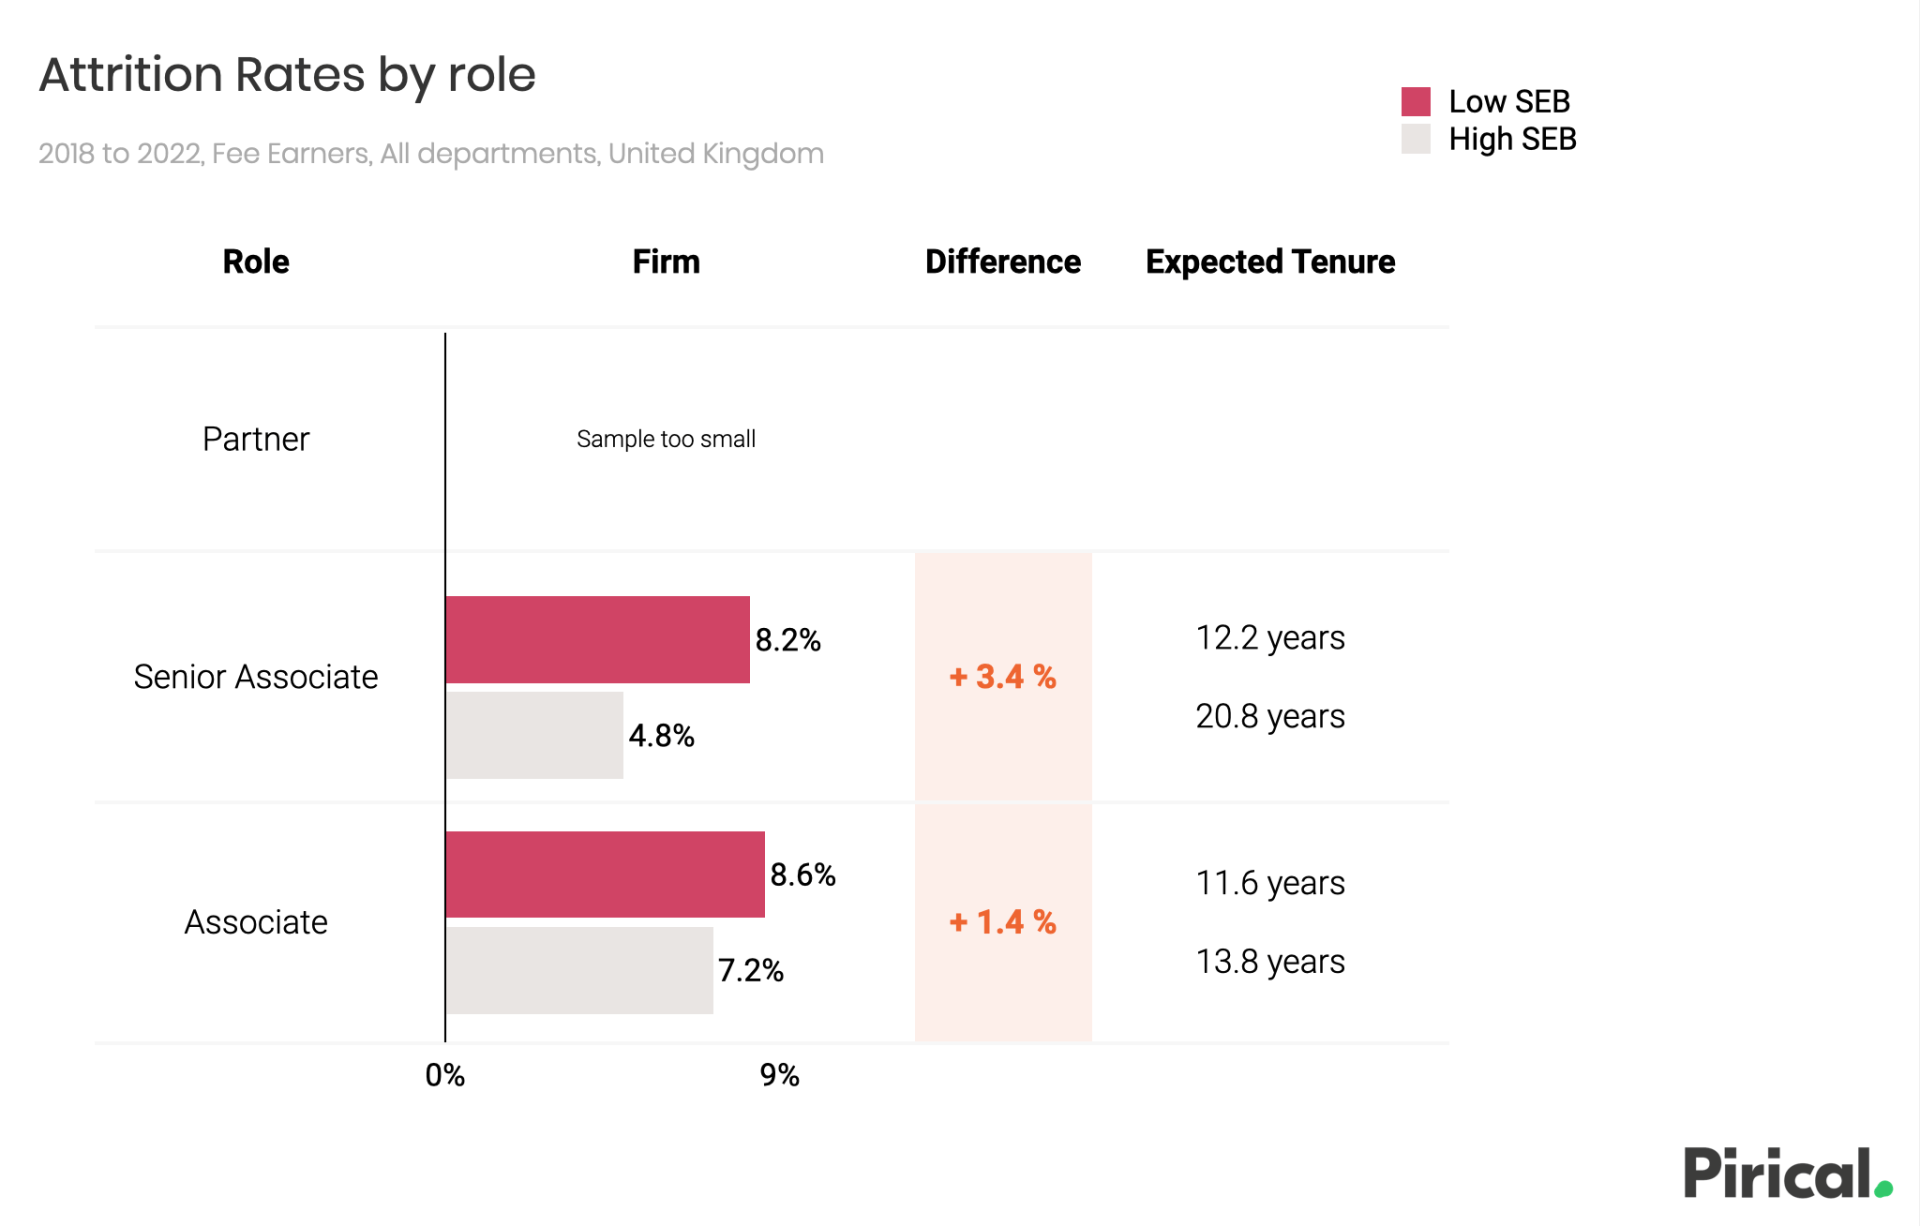
Low SEB Fee Earners at the firm have higher attrition rates than High SEB peers.
This attrition bias - to continue our metaphor - means the pipeline is leaky.
High SEB Associates are expected to stay at the firm for 2.2 years longer than Low SEB peers.
An Average Firm would also have higher attrition rates for Low SEB Associates and Senior Associates.
Using attrition data from all firms on Pirical On Demand, we can construct a market average.
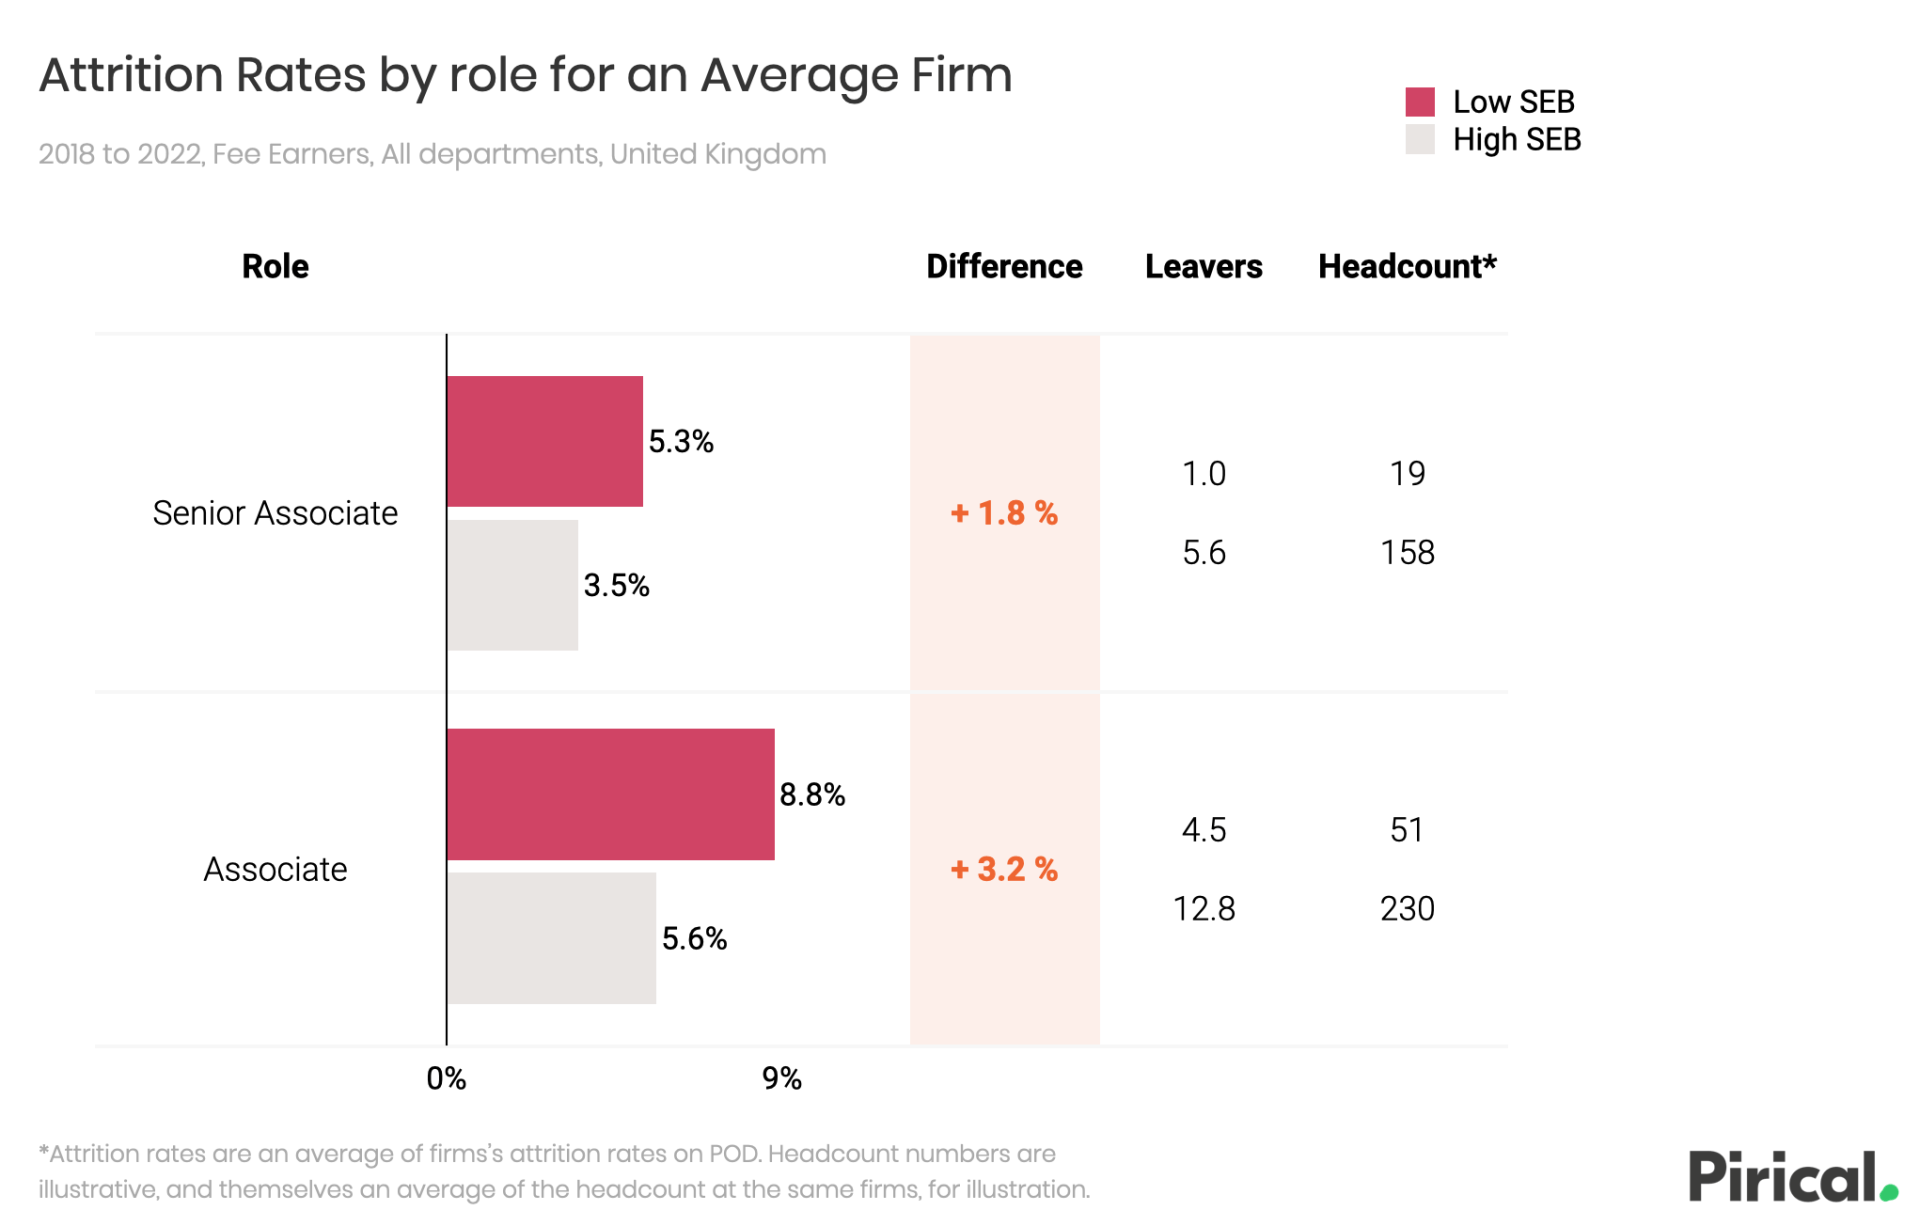
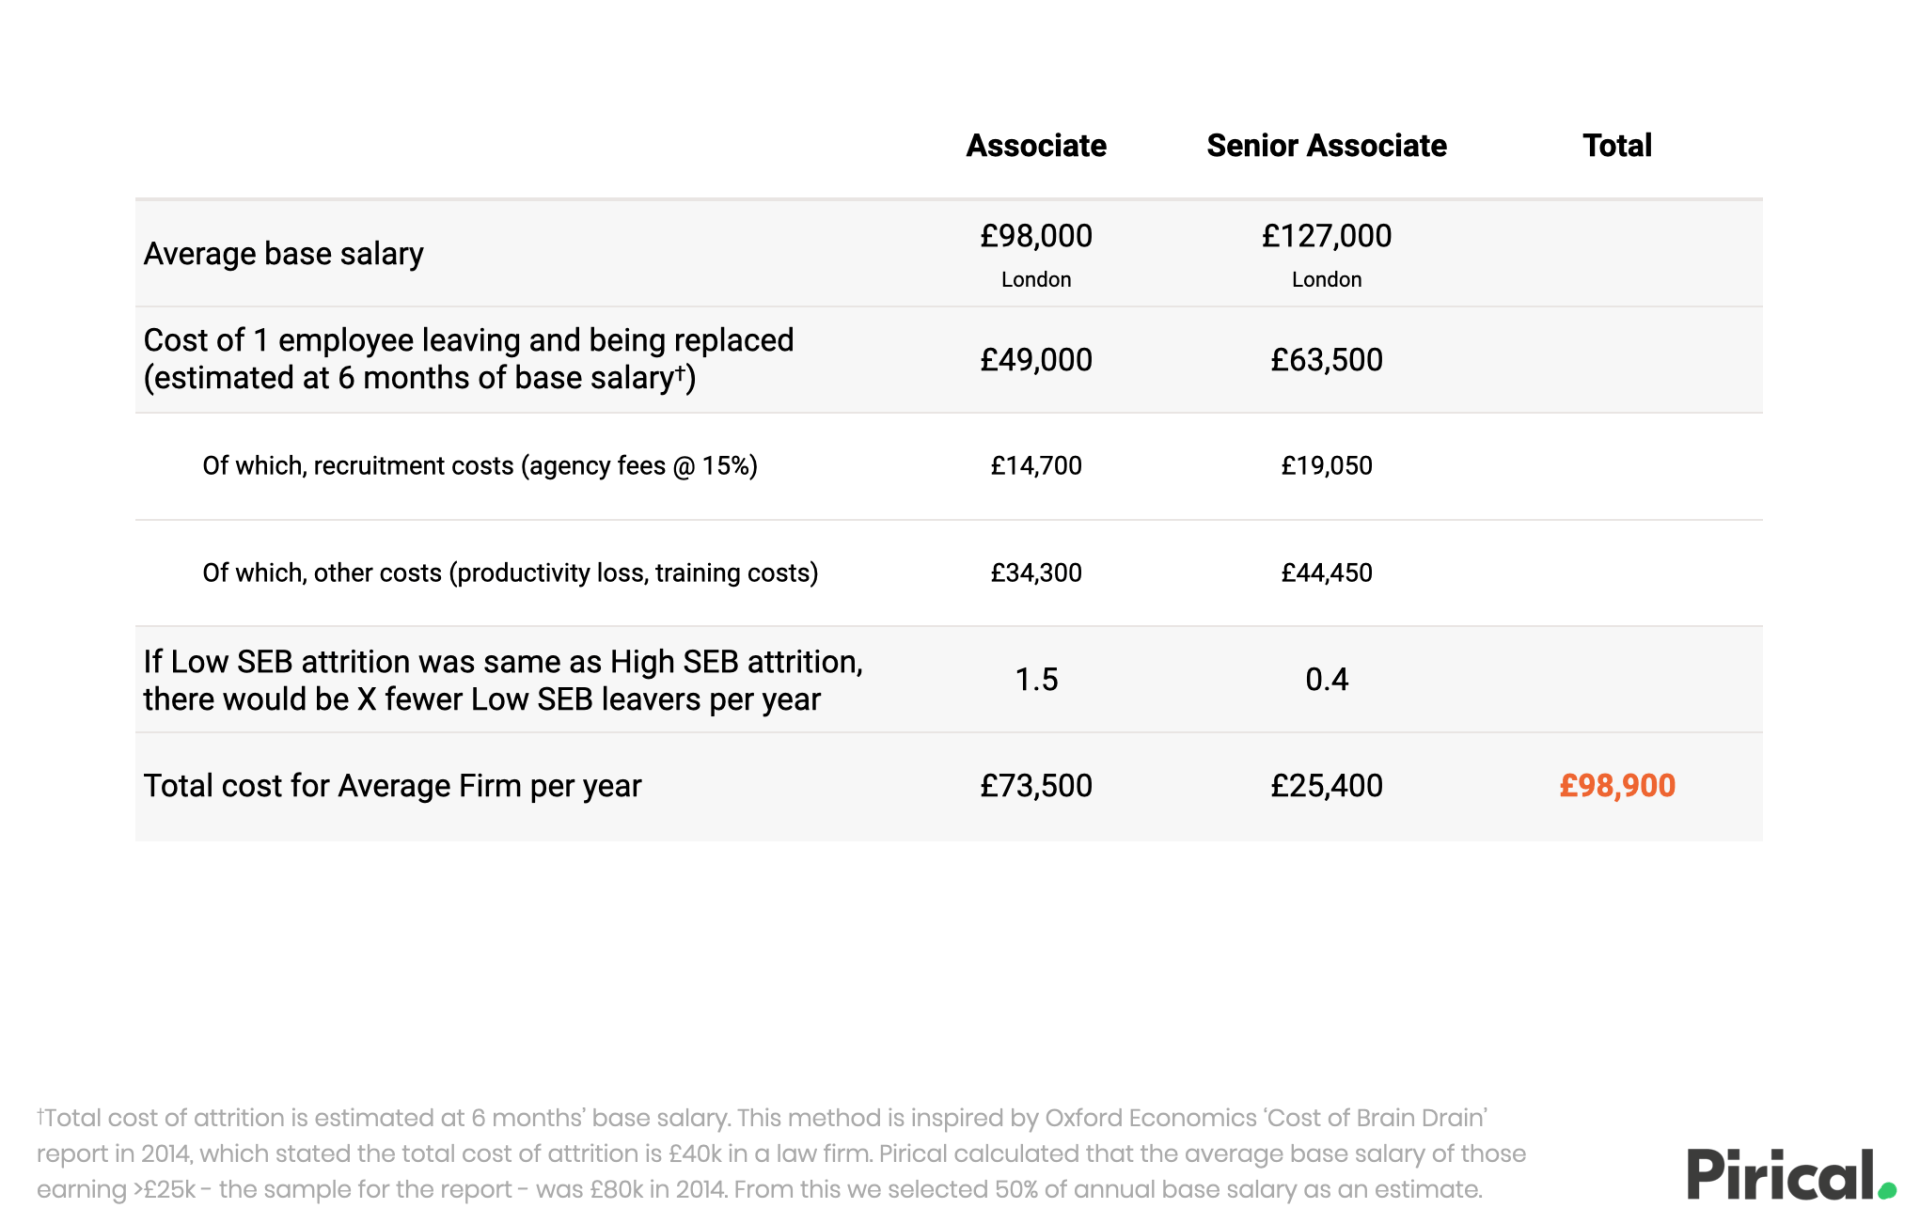
Excess Low SEB associate attrition costs our Average Firm nearly £100k per year
We estimated the financial cost of excess Low SEB associate attrition by considering the impact of reducing the Low SEB attrition rates to equal those of High SEB peers.
We have identified attrition bias.

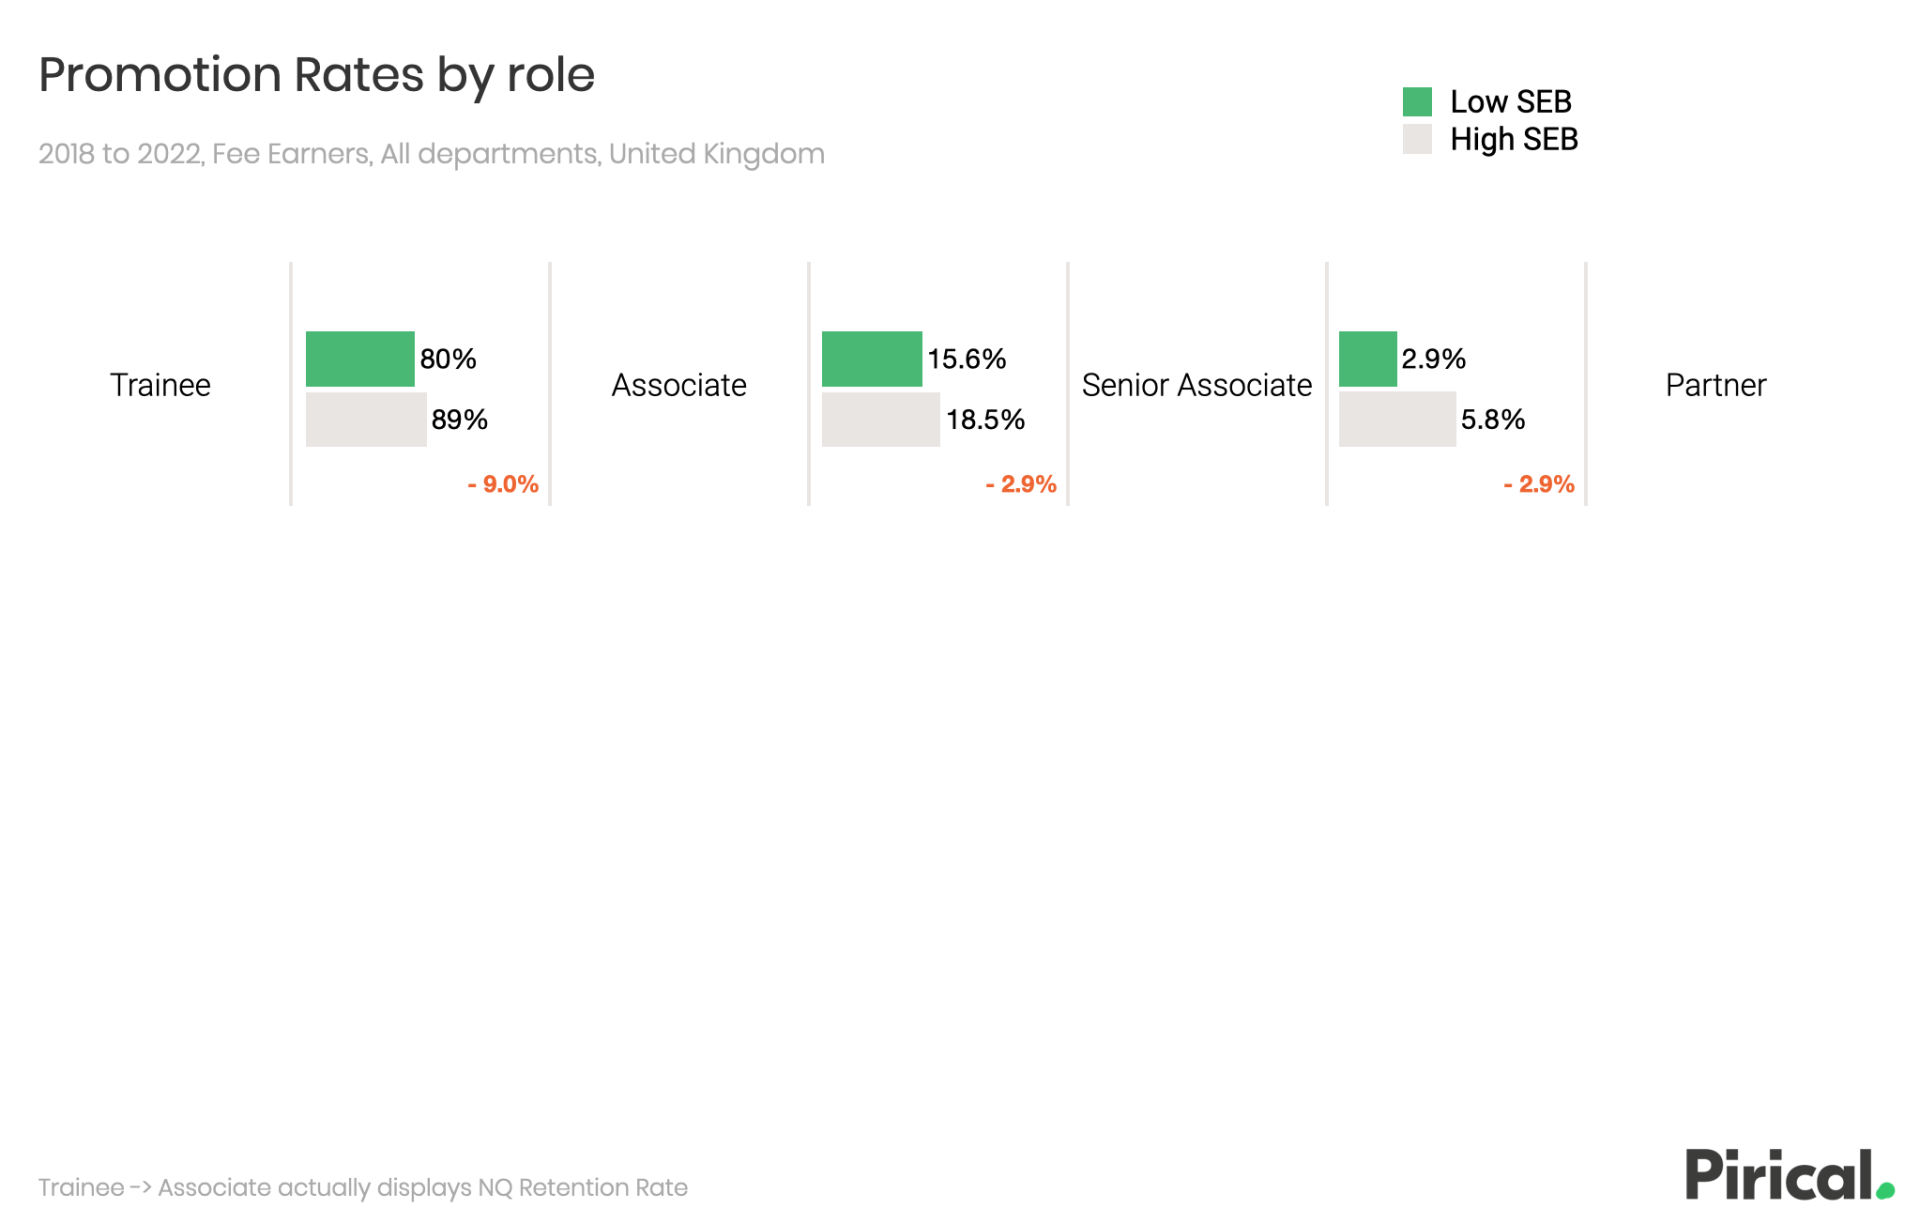
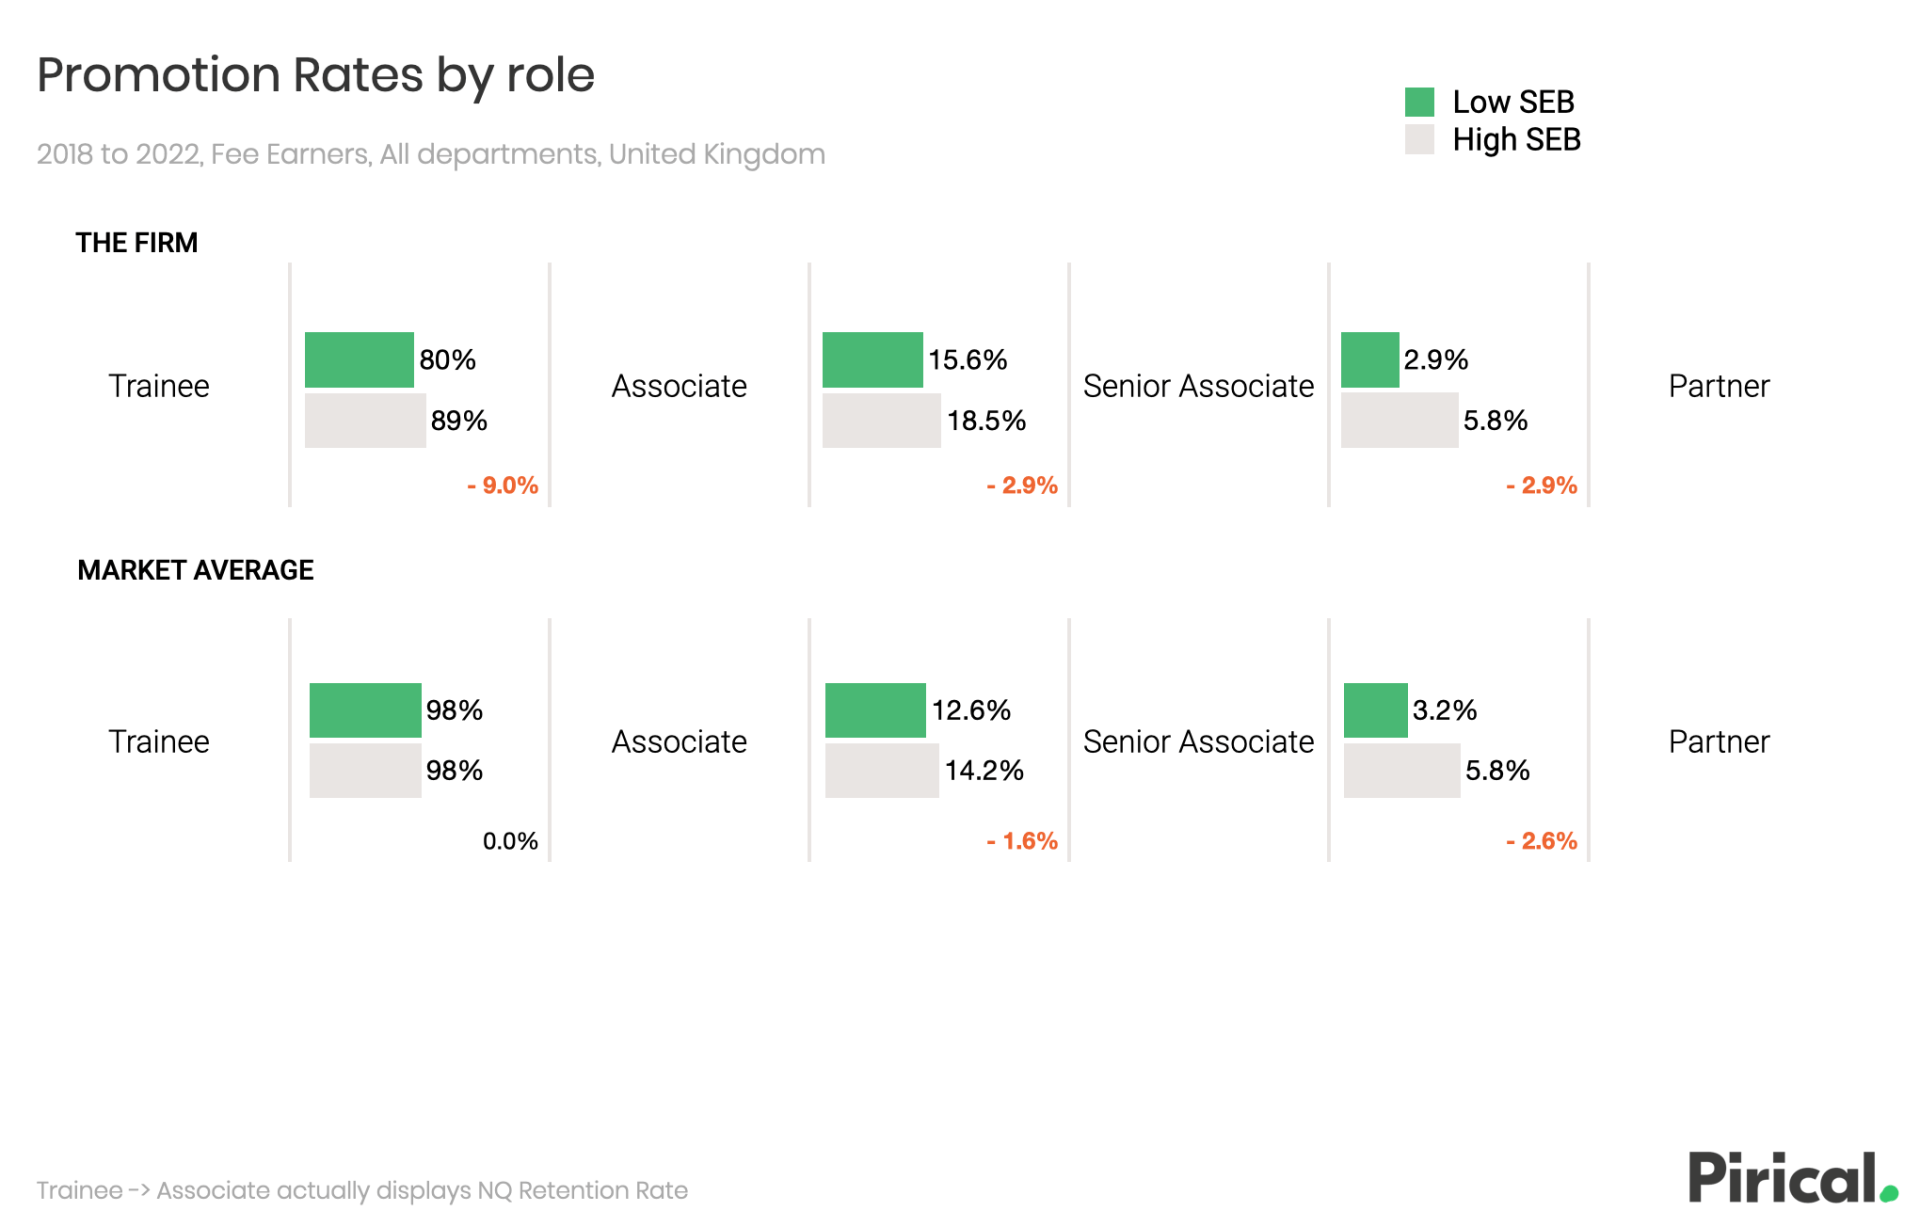
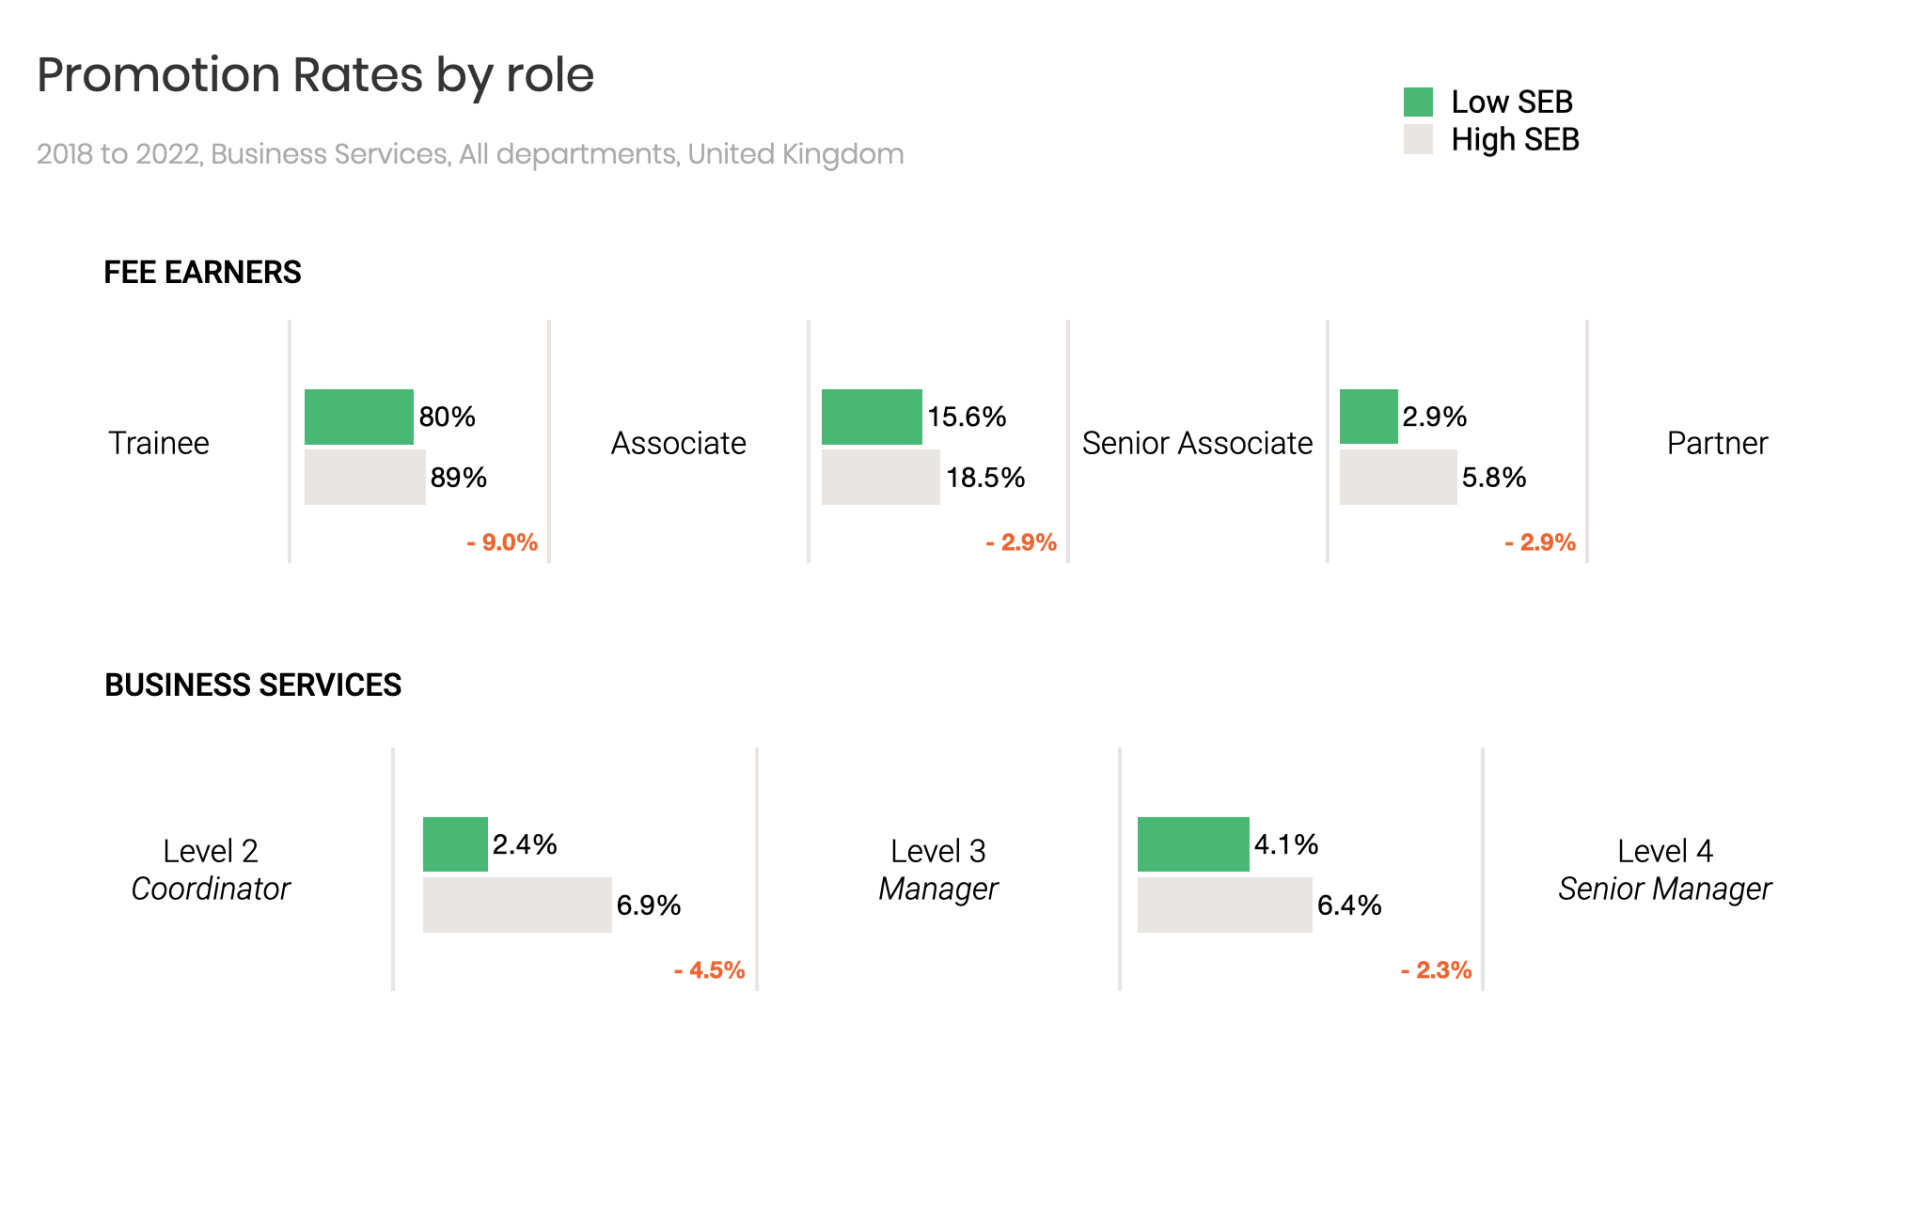
At every step of the career ladder Low SEB Fee Earners at the firm progress more slowly.
The pipeline for Low SEB talent is not just leaky, it’s clogged too.
Comparing against the market average, lower promotion rates for Low SEB Fee Earners is common across firms.
Although not at Trainee level.
We have identified promotion bias.
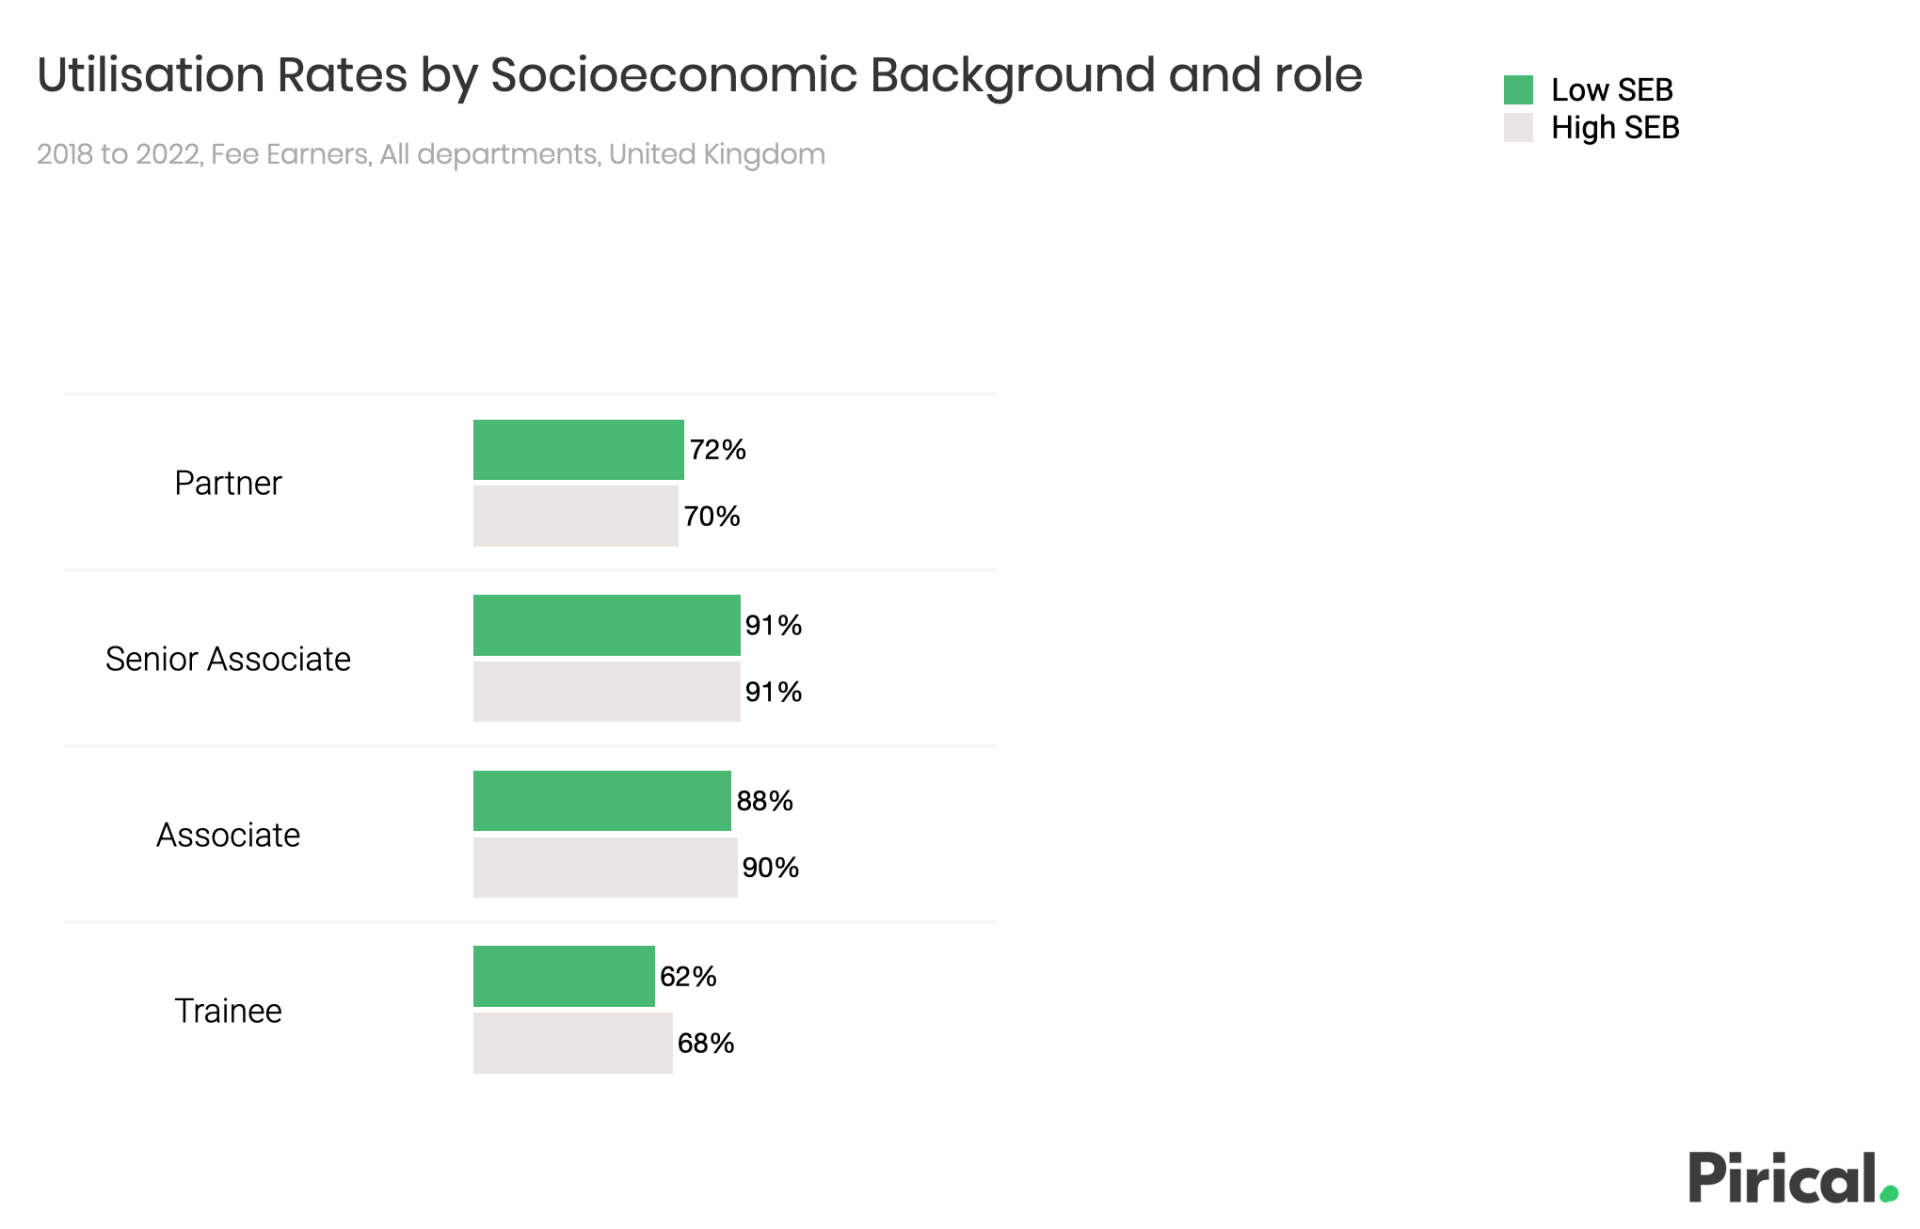
There are no obvious utilisation differences to explain outcomes.
Utilisation is the number of billed hours as a proportion of total hours. It is sometimes used as a metric of performance.
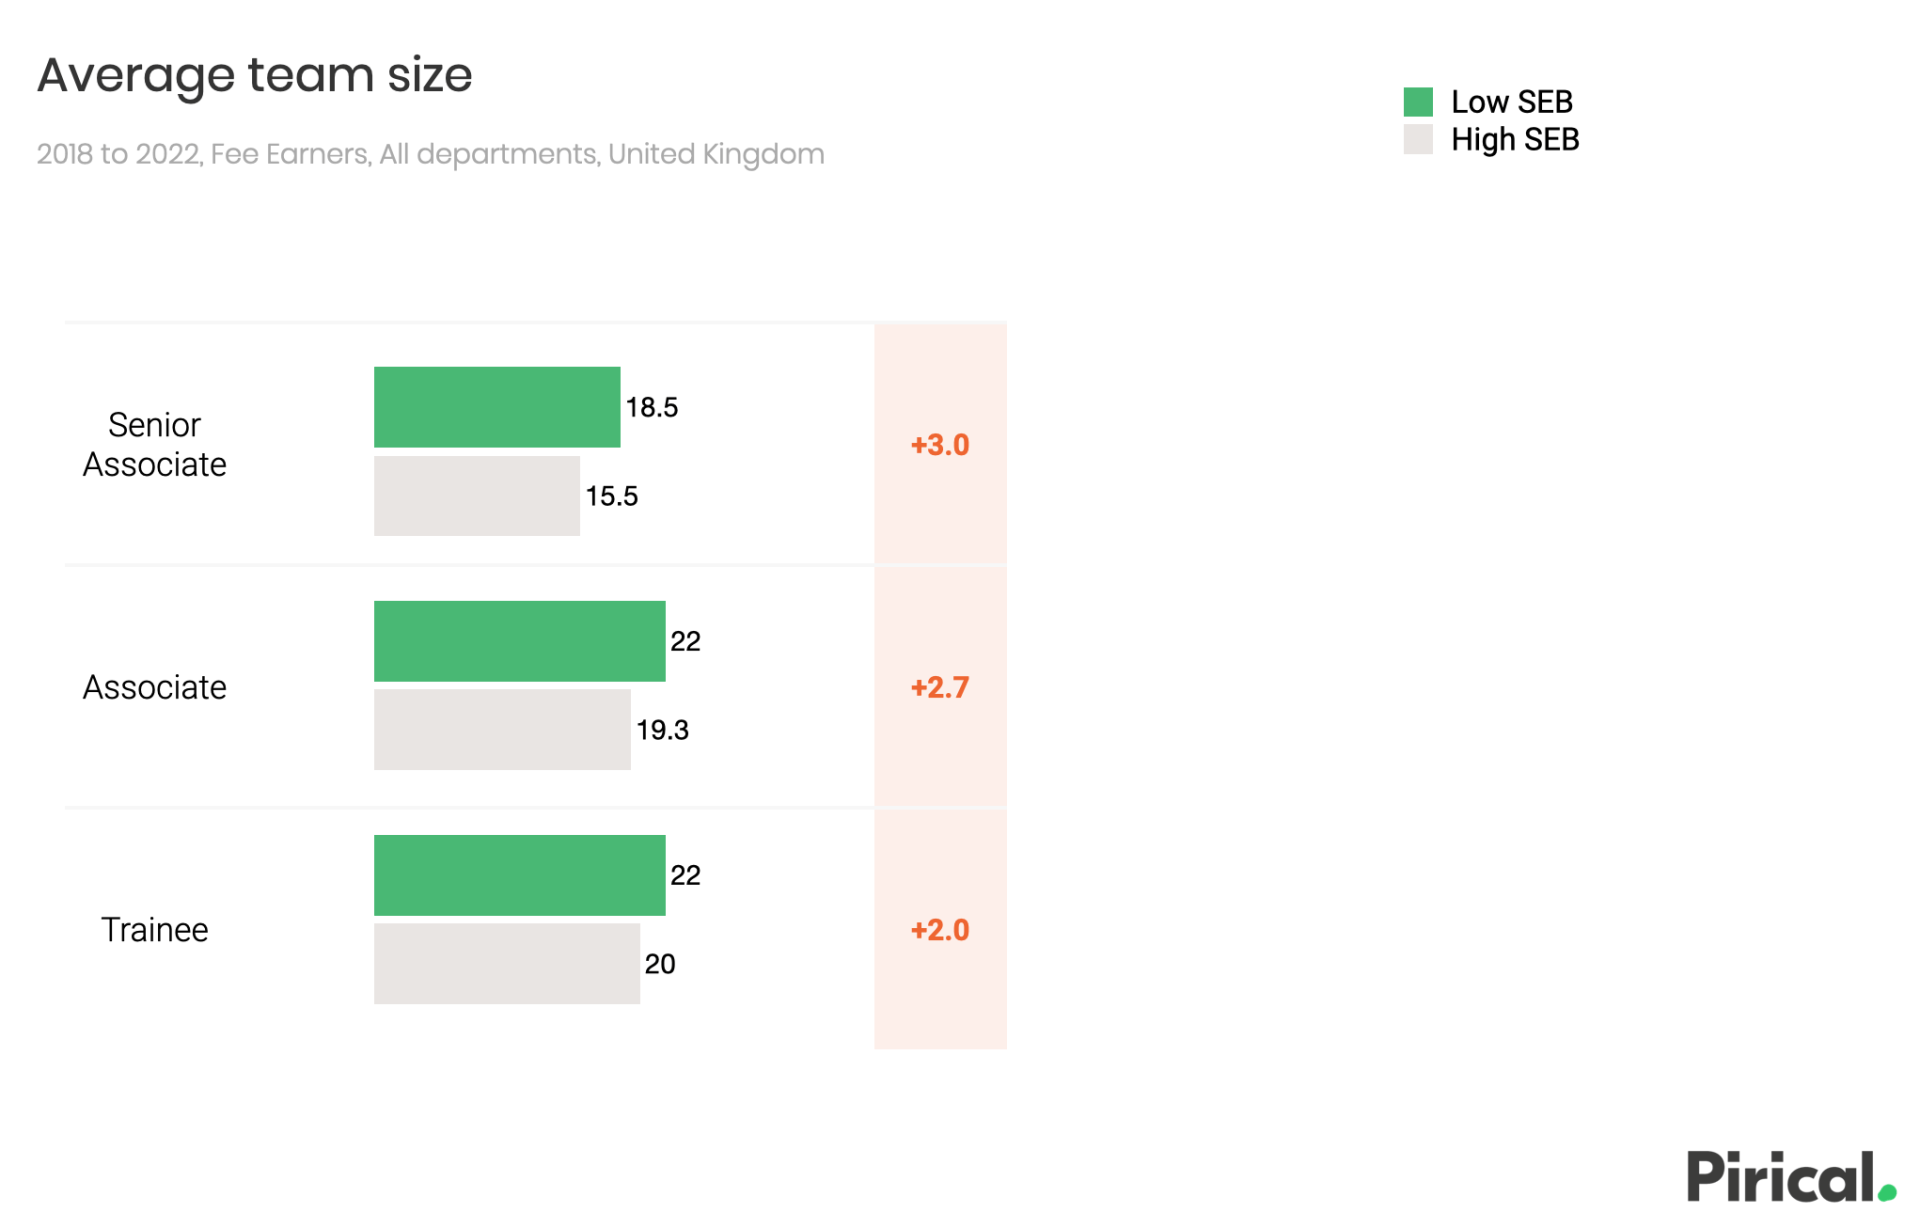
What else could be happening? Maybe it’s about access to opportunities. Low SEB Fee Earners on average work within larger teams.
We have some evidence that working on larger teams is associated with higher attrition rates and lower promotion rates.
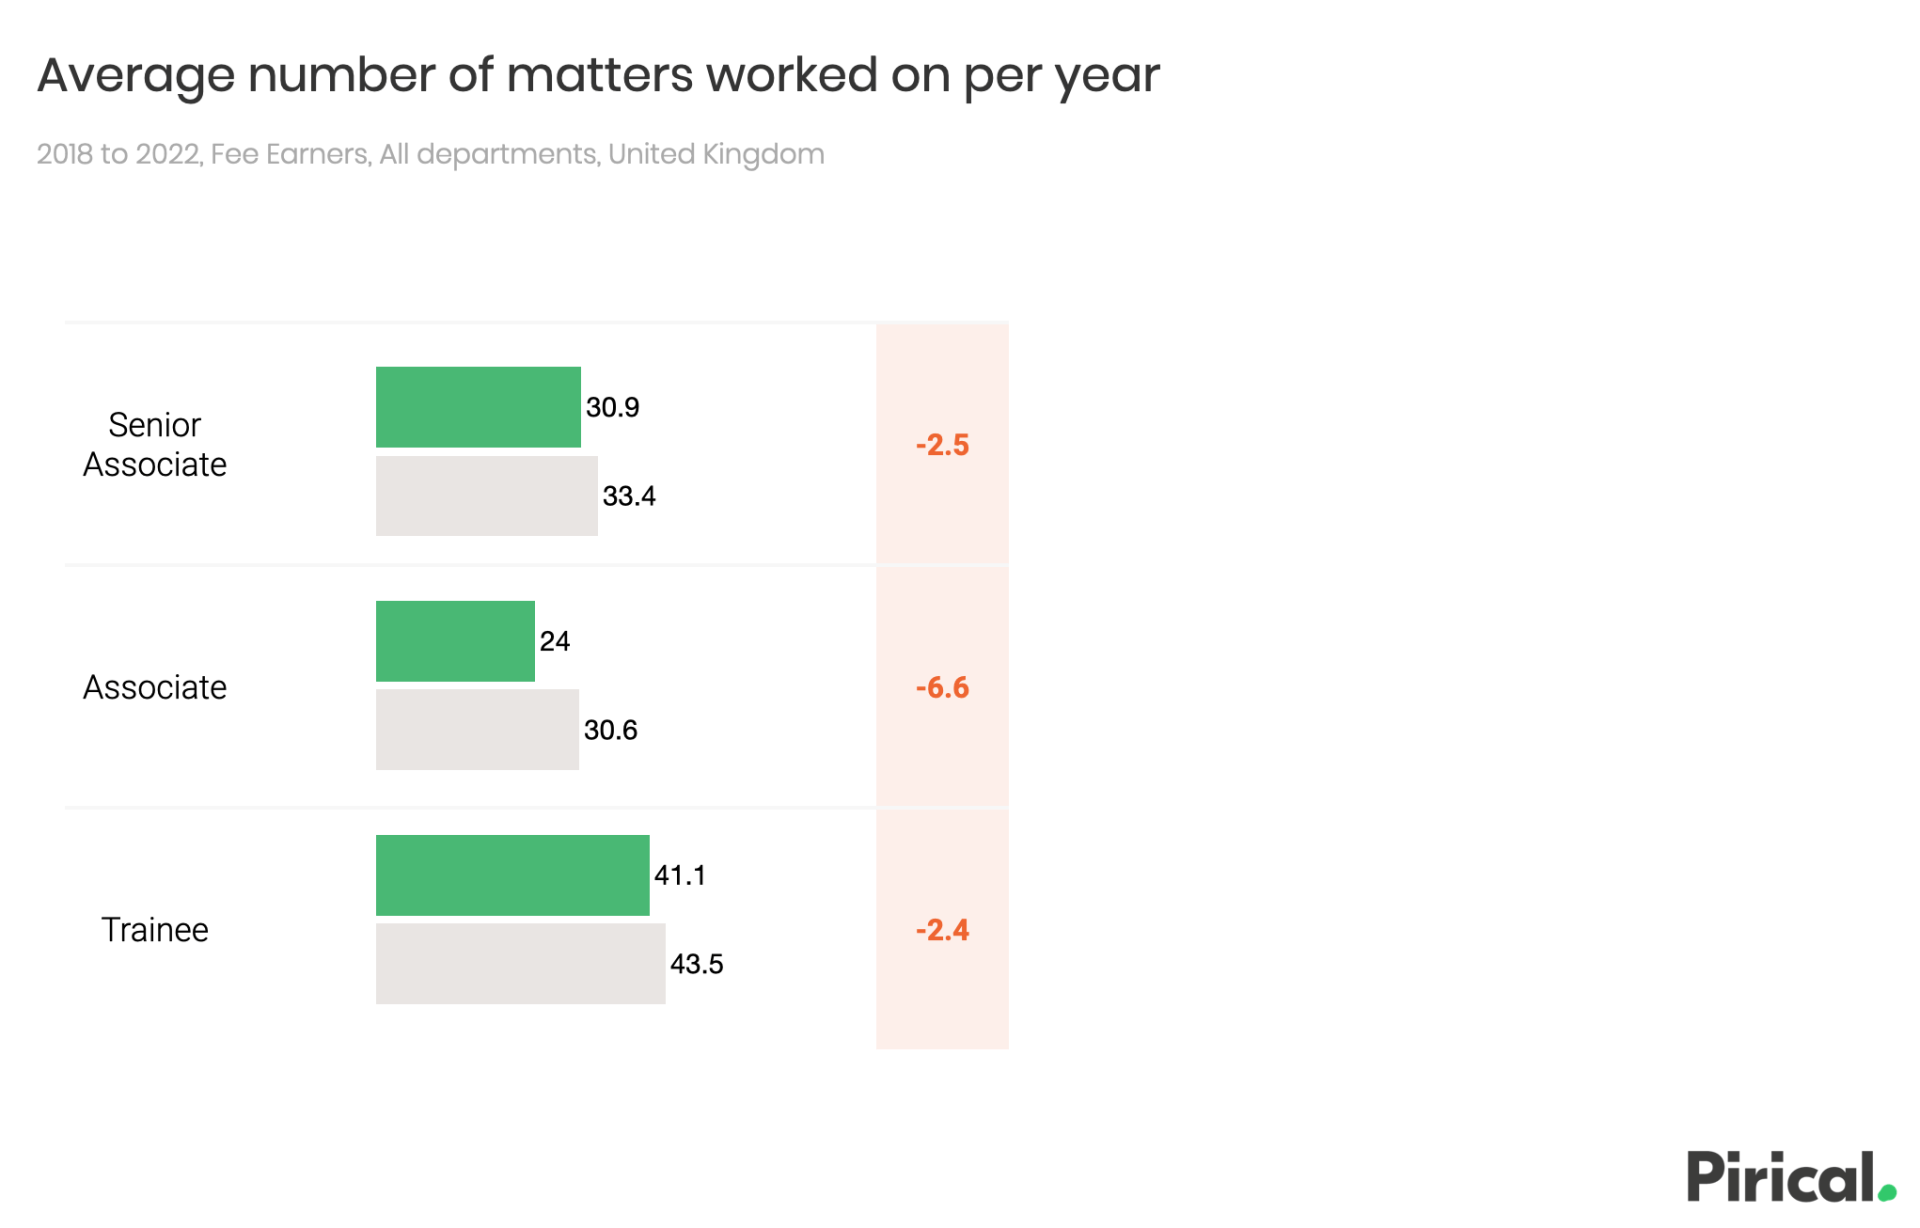
And Low SEB Fee Earners work on fewer matters per year, particularly Associates.
We also have some evidence that working on fewer matters is associated with higher attrition rates.
Ensuring balance in work allocation may be an effective mechanism for future change.
Something for next time. For the Business Services (Non-Fee Earning) population of the firm, the issues are similar, and potentially more acute.
Promotions from coordinator (or individual contributor) roles into the managerial ranks have the highest promotion gap.
Pirical On Demand is a flexible solution for real-time social mobility data analysis, and for all diversity traits. Ready to learn more? See how Pirical On Demand works.
Stay up-to-date with the latest market insights and law firm rankings
Subscribe to email updates
Subscribe to content


